2019 Hurricane Season iQuest

2019 Hurricane Season is Here
What is “hurricane season”?
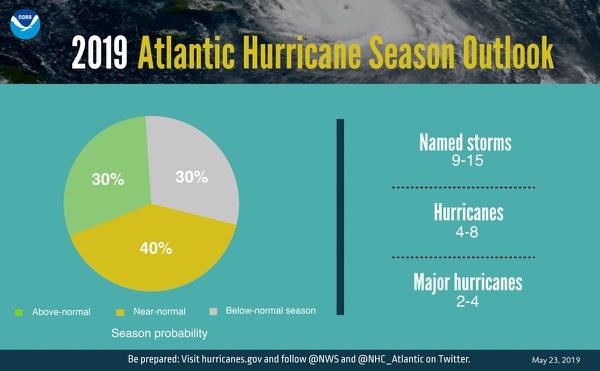
The Atlantic "hurricane season" officially begins on June 1st and runs through Nov. 30th. The Atlantic basin includes the Atlantic Ocean, Caribbean Sea, and Gulf of Mexico. The National Oceanic and Atmospheric Administration (NOAA) is predicting that we will have a stronger hurricane season this year. Click here to find out why they are making this predication and where you can go to see the latest hurricane activity.
Ever wonder why hurricanes have names? Visit this World Meteorological Organization (WMO) website to find out why they are named and see the names that are on board for this year's storms.
What are “hurricanes”?
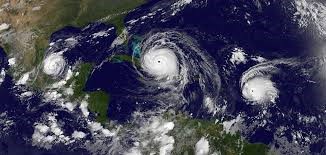
Hurricanes are the most violent storms on Earth. People call these storms by other names, such as typhoons or cyclones, depending on where they occur. The scientific term for all these storms is "tropical cyclone". Only tropical cyclones that form over the Atlantic Ocean or eastern Pacific Ocean are called "hurricanes." Whatever they are called, tropical cyclones all form the same way. Go to this NOAA website to find out how these storms form.
How does NASA study hurricanes?
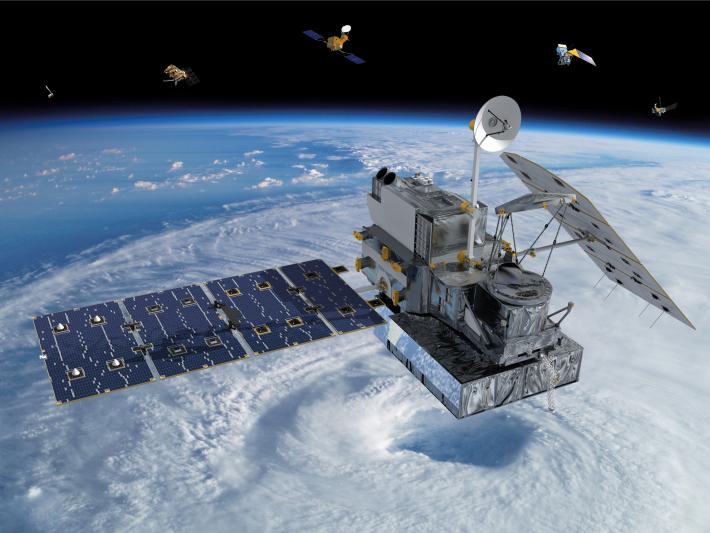
NASA's Global Precipitation Measurement (GPM) mission, which launched in 2014, has been keeping track of storms around the world. Watch "5 Years of Storms" to see how and why this mission is expanding our understanding about these deadly storms.
NASA satellites study tropical cyclones and have improved our ability to predict, monitor, and respond to these dangerous storms. In this video, Dr. Owen Kelly describes how NASA's GPM satellite was able to capture Hurricane Florence as it passed over the Carolinas in Sept. 2018.
Inside Hurricane Maria
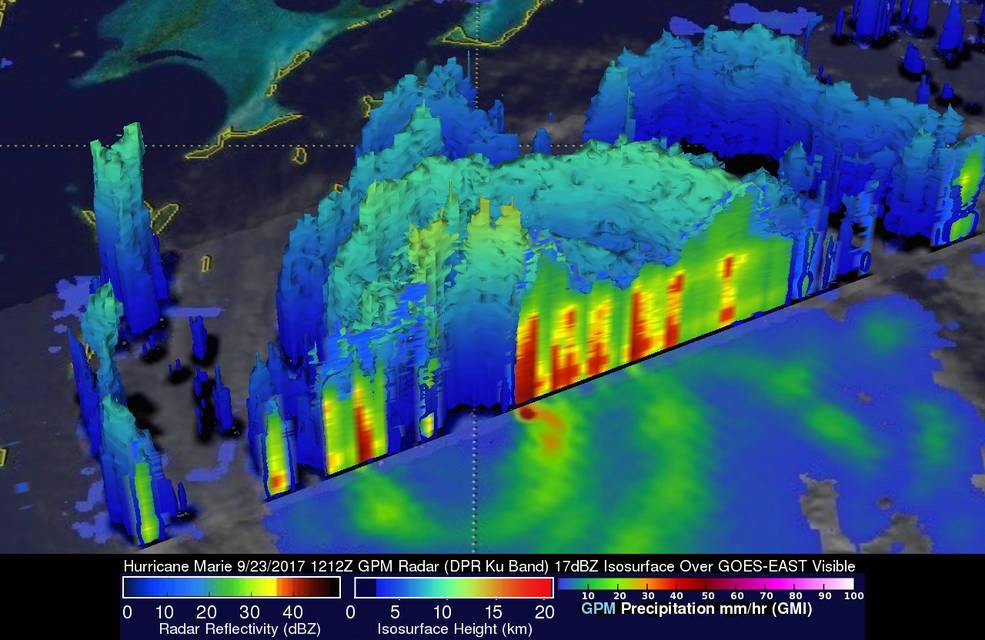
Hurricane Maria was a deadly Category 5 hurricane that devastated Dominica, the U.S. Virgin Islands, and Puerto Rico in September 2017. According to NOAA, this tropical cyclone caused over 90 billion dollars of damage and more than 3,000 people were killed. Two days before Hurricane Maria devastated Puerto Rico, the GPM satellite captured a 3D view of the storm. At the time Maria was a category 1 hurricane. The 3-D view reveals the processes inside the hurricane that would fuel the storm’s intensification to a category 5 storm within 24 hours.
Enter this data visualization to take you inside the hurricane- be sure to click and drag to look around and get the 360 ° prespective. GPM has an advanced radar that measures both liquid and frozen water. Looking at drop sizes and rainfall rates provides a key part of the equation in understanding hurricane intensity. Factors such as temperature, humidity, wind speed and clouds influence the size of precipitation particles, which in turn affects how much rain falls and how a storm grows. These advanced satellite measurements are critical for improving forecasts of how these powerful storms may intensify and where they may go.
Try building your own LEGO model of Hurricane Irma's GPM precipitation data with these directions.
Visit NASA's Hurricanes and Tropical Storms website to keep abreast of the latest news and information during this hurricane season.
NASA GPM
NASA GPM


