Browse Front Page Features Resources
Browse Front Page Features Resources
Primary Topic:
Subtopics:
Type:
Summary:
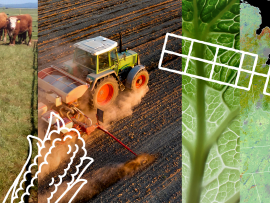
NASA’s Earth observations have a significant impact on the food we eat and drink. The NASA At Your Table campaign creates awareness of the many ways in which these data are being used by a variety of stakeholders to help get food and drink to your table..

Primary Topic:
Subtopics:
Type:
Summary:
A collection of resources exploring how NASA satellites like GPM can help monitor and predict Earth's climate.

Primary Topic:
Type:
Summary:
This collection of resources helps teach how to access and use GPM precipitation data, and how and why researchers measure precipitation from space.
Primary Topic:
Type:
Summary:
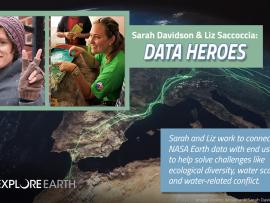
This collection of resources shares some of the people using GPM and other NASA Earth data, and how they help improve life around the world.
Primary Topic:
Subtopics:
Type:
Summary:
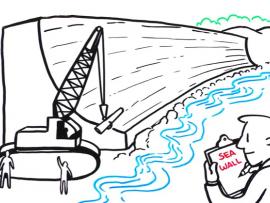
In this IQuest, you will explore resources to help you learn about the Sentinel-6 Michael Freilich satellite, the science behind sea level rise, and the STEM related careers of several of the scientists and engineers involved with this effort.

Primary Topic:
Subtopics:
Type:
Keywords:
Summary:
Learn all about hurricanes, the most violent storms on Earth, and how NASA uses satellites to study and understand these storms.

Primary Topic:
Type:
Summary:
Celebrate the 50th anniversary of GPM with some new lesson plans about how people are using GPM precipitation data to improve lives around the world.

Primary Topic:
Type:
Summary:
This interactive lesson uses a blow-up globe and a kinesthetic activity to help participants gain an understanding of how much water is on Earth’s surface.
Primary Topic:
Subtopics:
Type:
Keywords:
Summary:
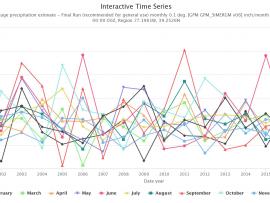
Did you know NASA has satellites that observe rain and snow all over the world? With this activity you can access NASA data to see how much precipitation was observed by satellites for your location any time from June 2000 to the present.

Primary Topic:
Subtopics:
Type:
Summary:
Use this iQuest to find out about predictions for the 2019 hurricane season and discover how hurricanes form. You will also learn how NASA satellite data is being used to help predict, monitor, and respond to these deadly storms.