Browse Weather and Climate Resources
Browse Weather and Climate Resources

Primary Topic:
Subtopics:
Type:
Summary:
A collection of resources exploring how NASA satellites like GPM can help monitor and predict Earth's climate.

Primary Topic:
Subtopics:
Type:
Keywords:
Summary:
Learn all about hurricanes, the most violent storms on Earth, and how NASA uses satellites to study and understand these storms.

Primary Topic:
Subtopics:
Type:
Summary:
Students will use various visualizations (i.e. images, charts, and graphs) to explore the energy exchange that occurs when hurricanes extract heat energy from the ocean.

Primary Topic:
Type:
Keywords:
Summary:
Students will analyze surface temperature and solar radiation data to construct explanations about the relationship of seasons and temperature to the amount of solar energy received on Earth’s surface.

Primary Topic:
Subtopics:
Type:
Summary:
In this lesson, students will learn how to compare data displays related to tropical cyclones to identify patterns and relationships in the data. They will be able to create their own data displays or use the ones provided.

Primary Topic:
Subtopics:
Type:
Summary:
Learn all about hurricanes, the most violent storms on Earth.
Primary Topic:
Subtopics:
Type:
Keywords:
Summary:
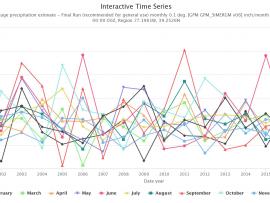
Did you know NASA has satellites that observe rain and snow all over the world? With this activity you can access NASA data to see how much precipitation was observed by satellites for your location any time from June 2000 to the present.

Primary Topic:
Subtopics:
Type:
Summary:
Use this iQuest to find out about predictions for the 2019 hurricane season and discover how hurricanes form. You will also learn how NASA satellite data is being used to help predict, monitor, and respond to these deadly storms.

Primary Topic:
Subtopics:
Type:
Standards:
Keywords:
Summary:
Step by step instructions and a parts list to build your own LEGO model of GPM precipitation data collected from Hurricane Irma on 9/5/17.

Primary Topic:
Subtopics:
Type:
Summary:
For the first time in 360 degrees, this data visualization takes you inside a hurricane. The precipitation satellite has an advanced radar that measures both liquid and frozen water. Click and drag to look around.