How to Use GPM Data
This collection of resources helps teach how to access and use GPM precipitation data, and how and why researchers measure precipitation from space.
Learn How to Use GPM Precipitation Data
GPM Data Homepage
Precipitation data from the GPM and TRMM missions are made available free to the public in a variety of formats from several sources at NASA Goddard Space Flight Center. This page outlines the different types of data available, the levels of processing, the sources to download the data, and some helpful tips for utilizing precipitation data in your research.
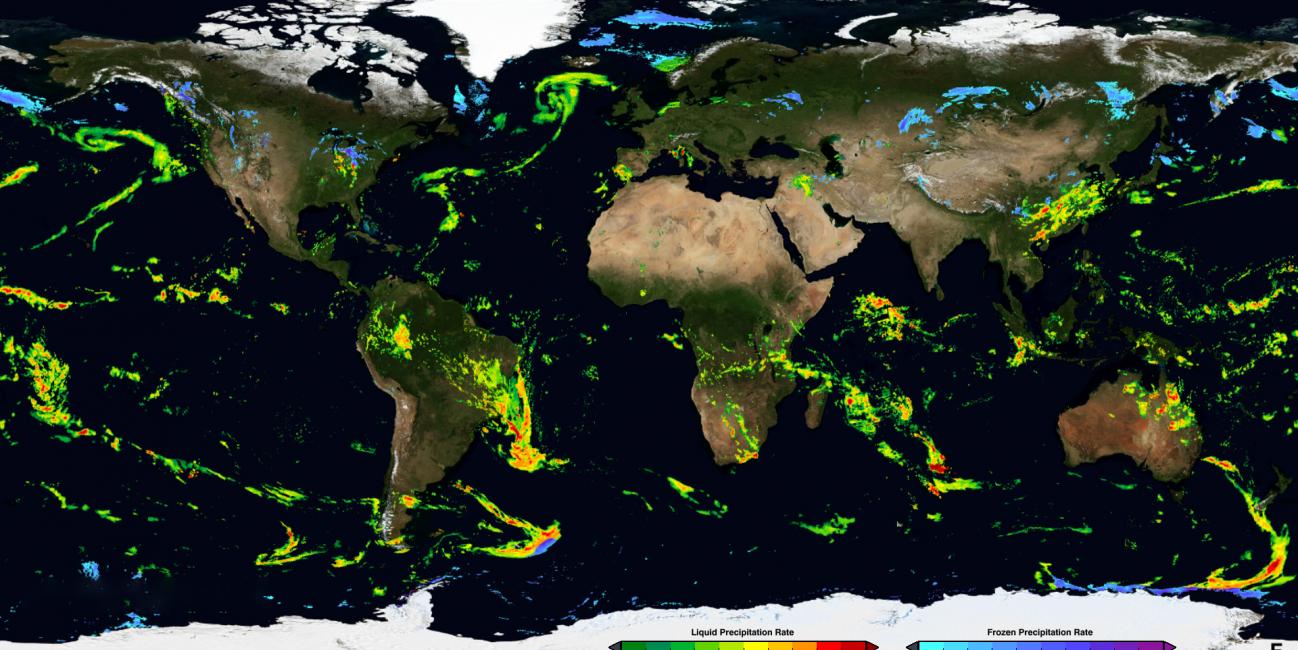
From Satellites to Your Backyard
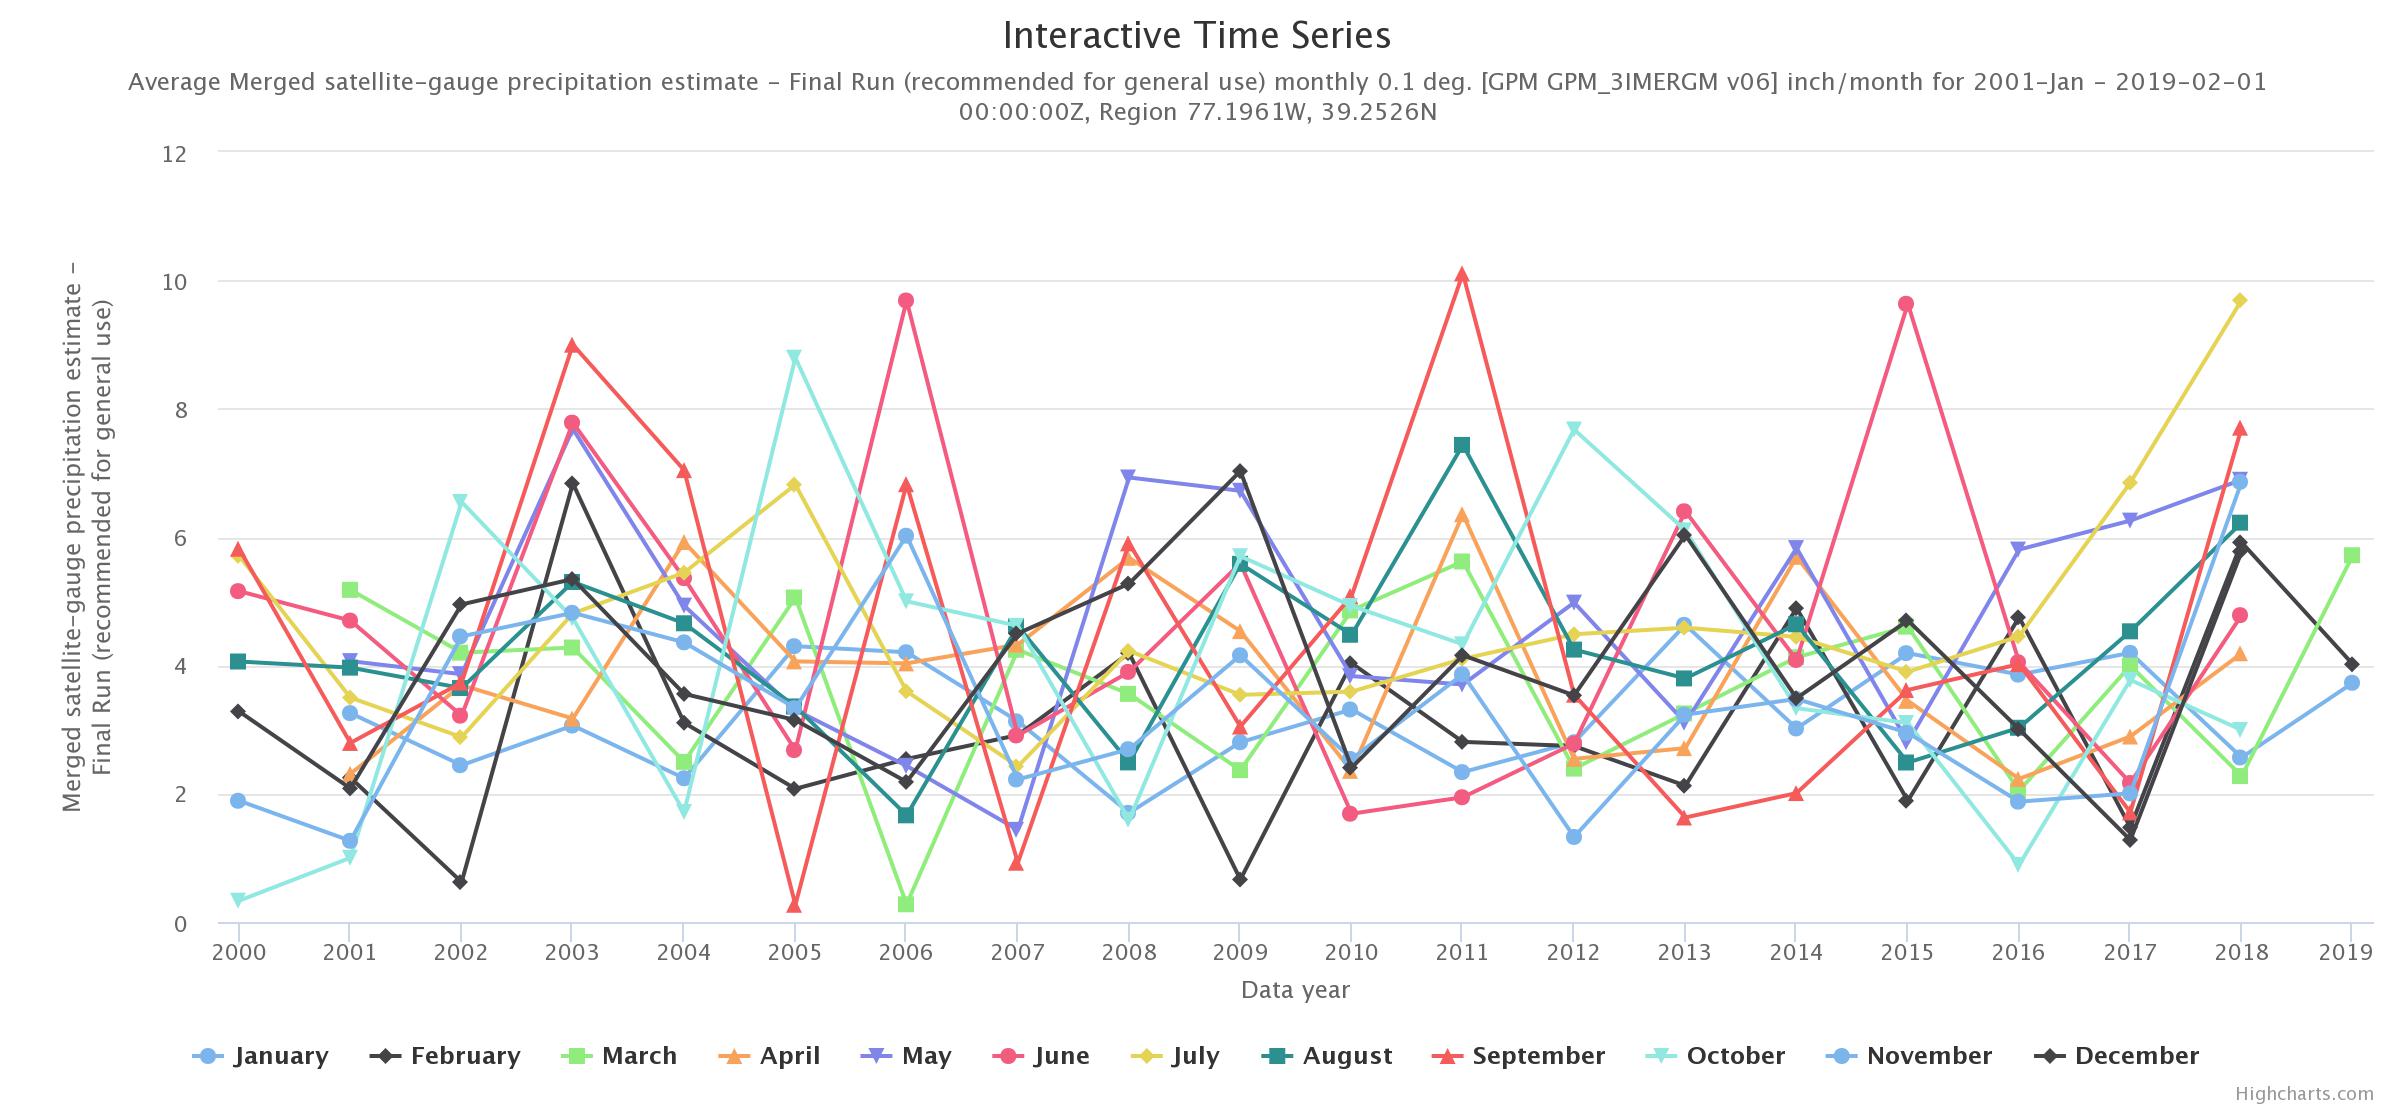
Did you know NASA has satellites that observe rain and snow all over the world? With this activity you can access NASA data to see how much precipitation was observed by satellites for your location any time from June 2000 to the present.
Measuring Precipitation Lesson Plan
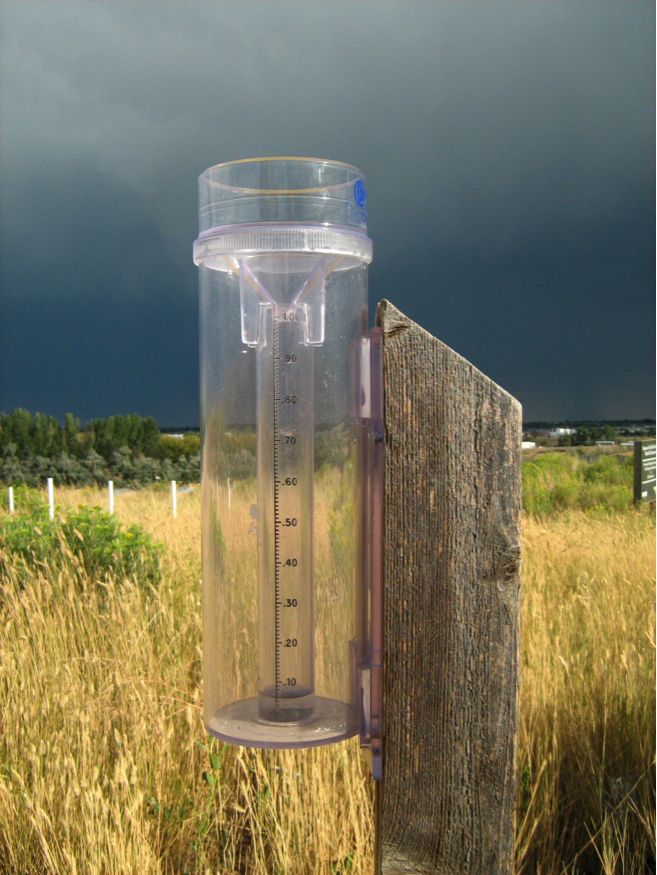
This is an inquiry-based, hands-on activity that has been created to engage students in designing and testing a rain gauge. Throughout this one-hour lesson, students are given an engineering problem (measuring precipitation), easily obtainable materials and tools, and time to design and test their rain gauges. Students will simulate rain to test the gauge and compare their results. The comparison of results leads to a discussion about the need for a standardized calibration system to be used to get precise measurements that are reliable. Students are then introduced to the Global Precipitation Measurement (GPM) mission and learn how GPM will measure precipitation around the globe in new ways.
Precipitation Towers Lesson Plan
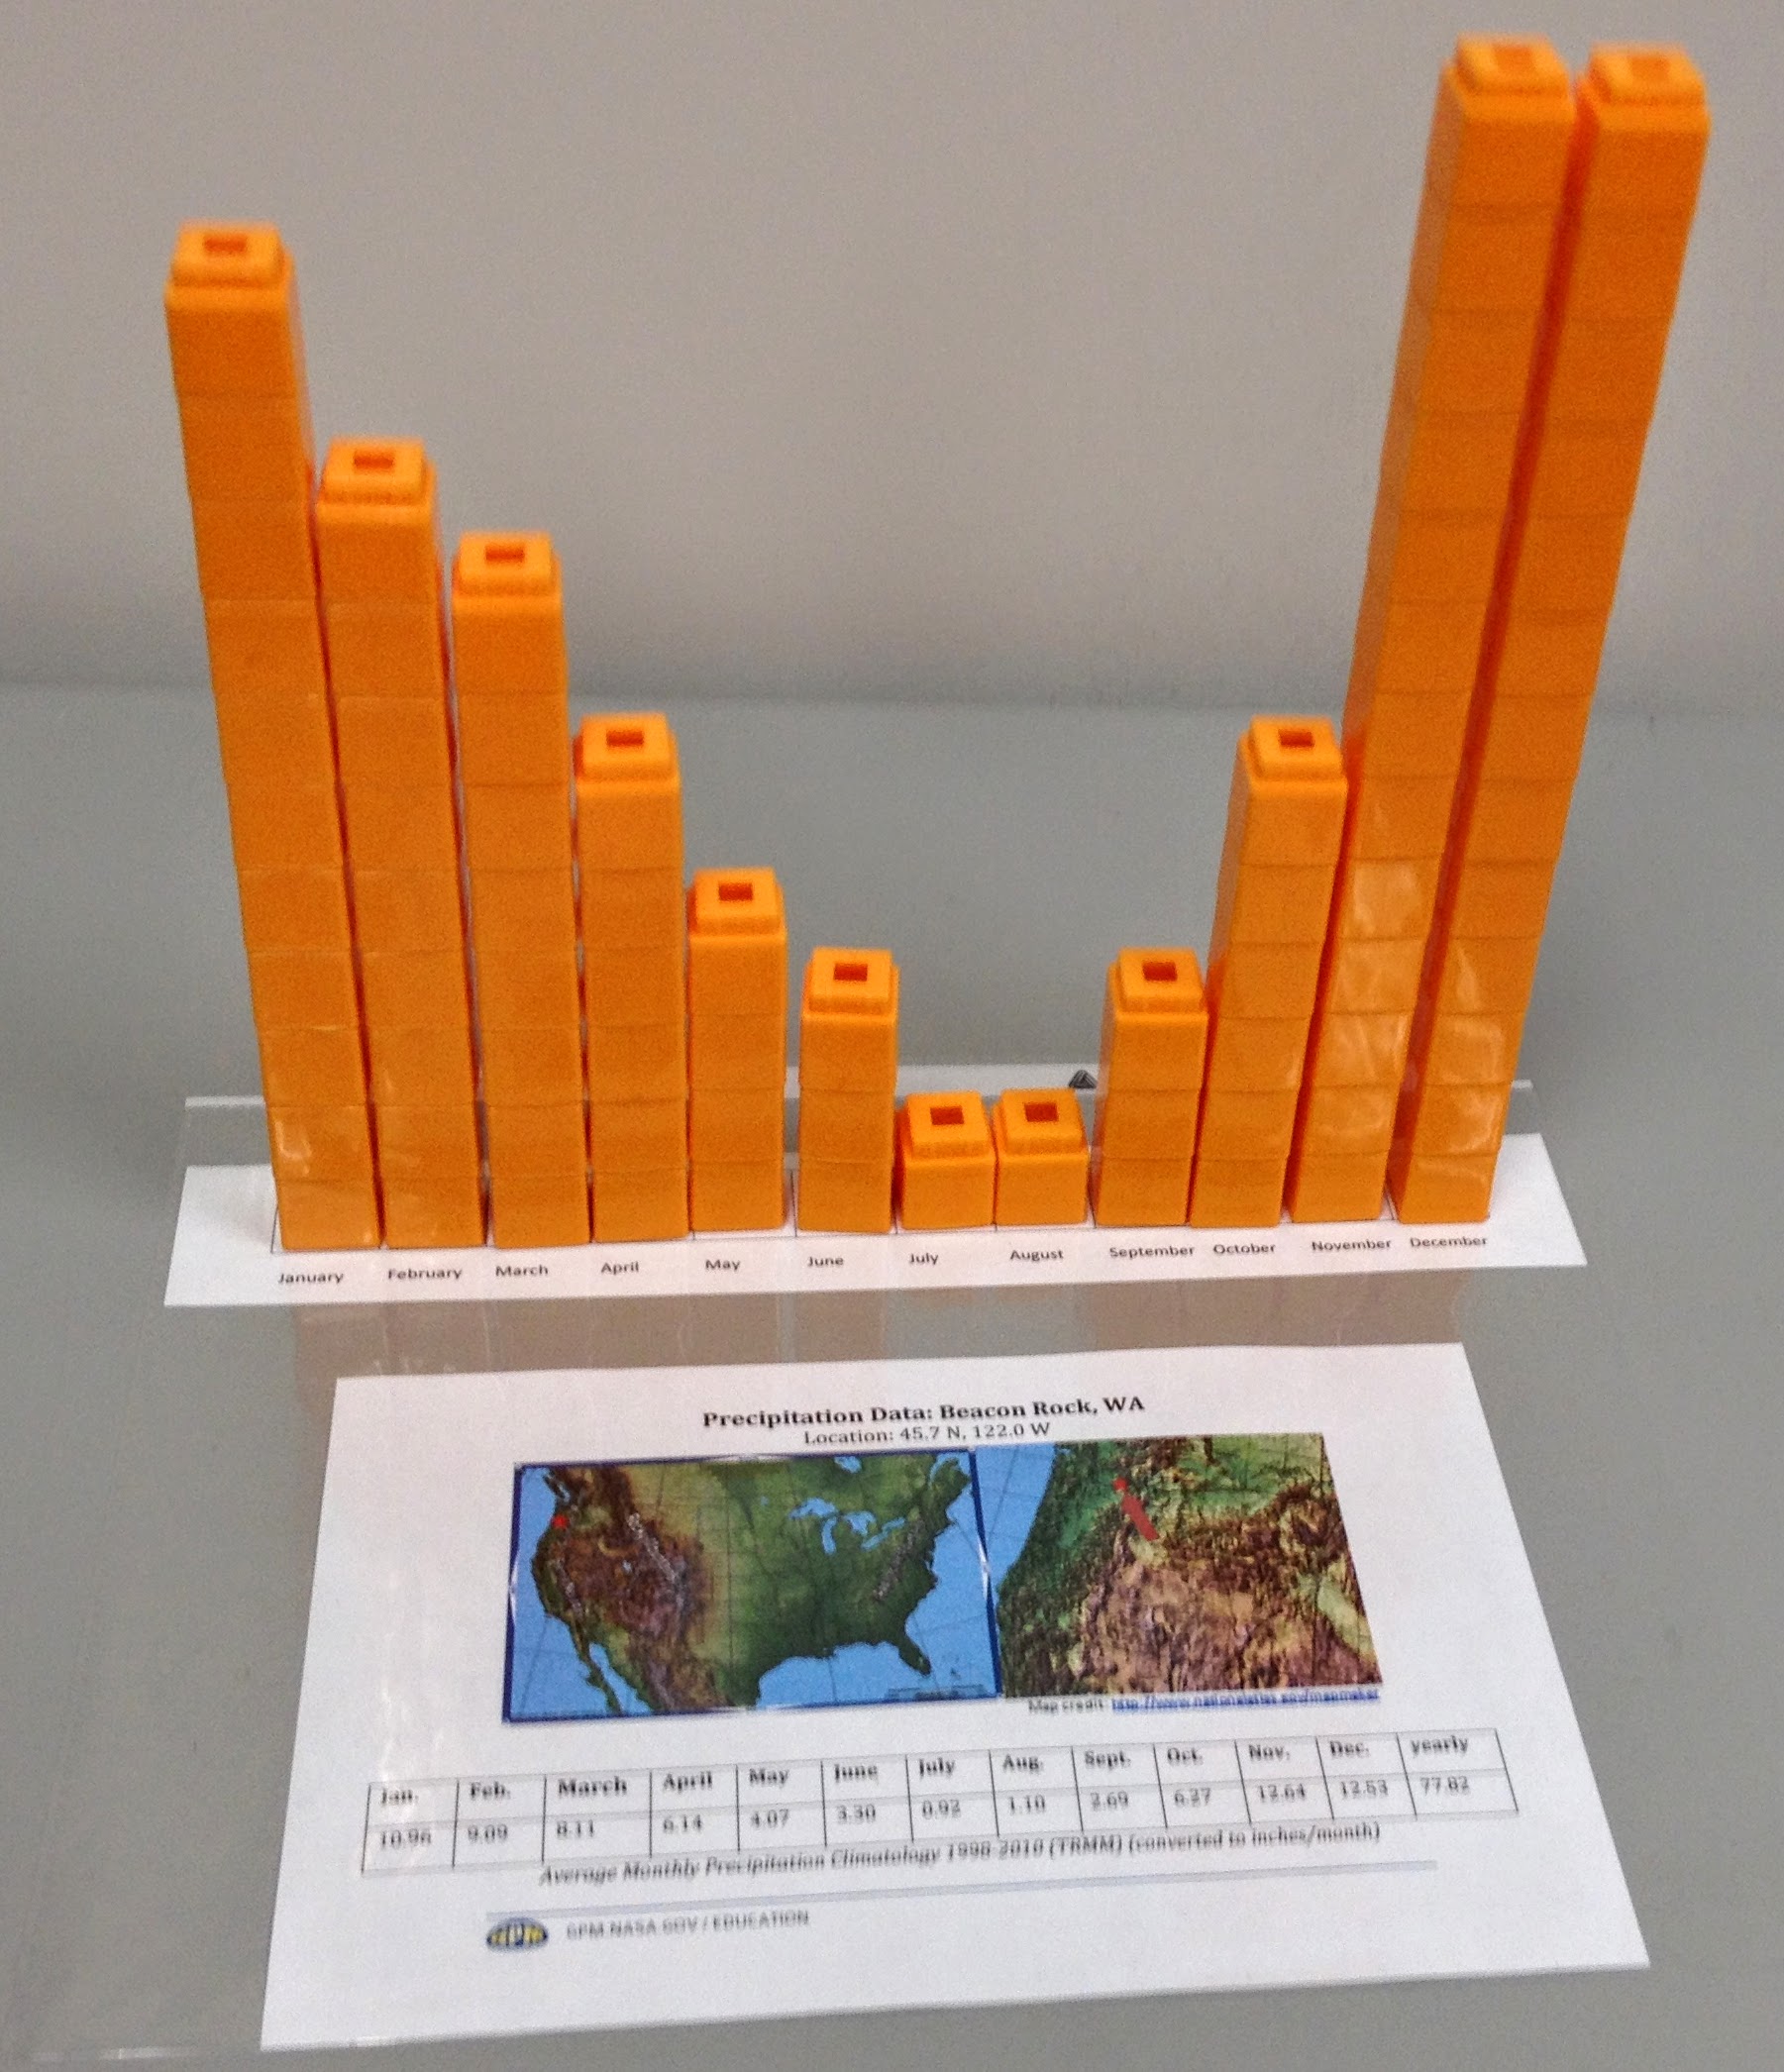
This lesson guides students to explore precipitation patterns in different locations by using cubes to make graphs of precipitation data. There are basic and intermediate versions requiring different levels of math skill (rounding decimals as well as analysis tools such as mean and range). After the students build the towers and make observations of the patterns of precipitation in their particular location, they can have a discussion as a class or in smaller groups to compare patterns in different locations, as well as thinking about other data that might be useful in analyzing the weather, as well as the impacts of having too much or too little precipitation. Extensions include various videos and animated datasets to prompt more observations and discussion. Instructions are also given for teachers to access data to create templates for their own locations.
Learn How and Why NASA Measures Preciptation from Space
For Good Measure
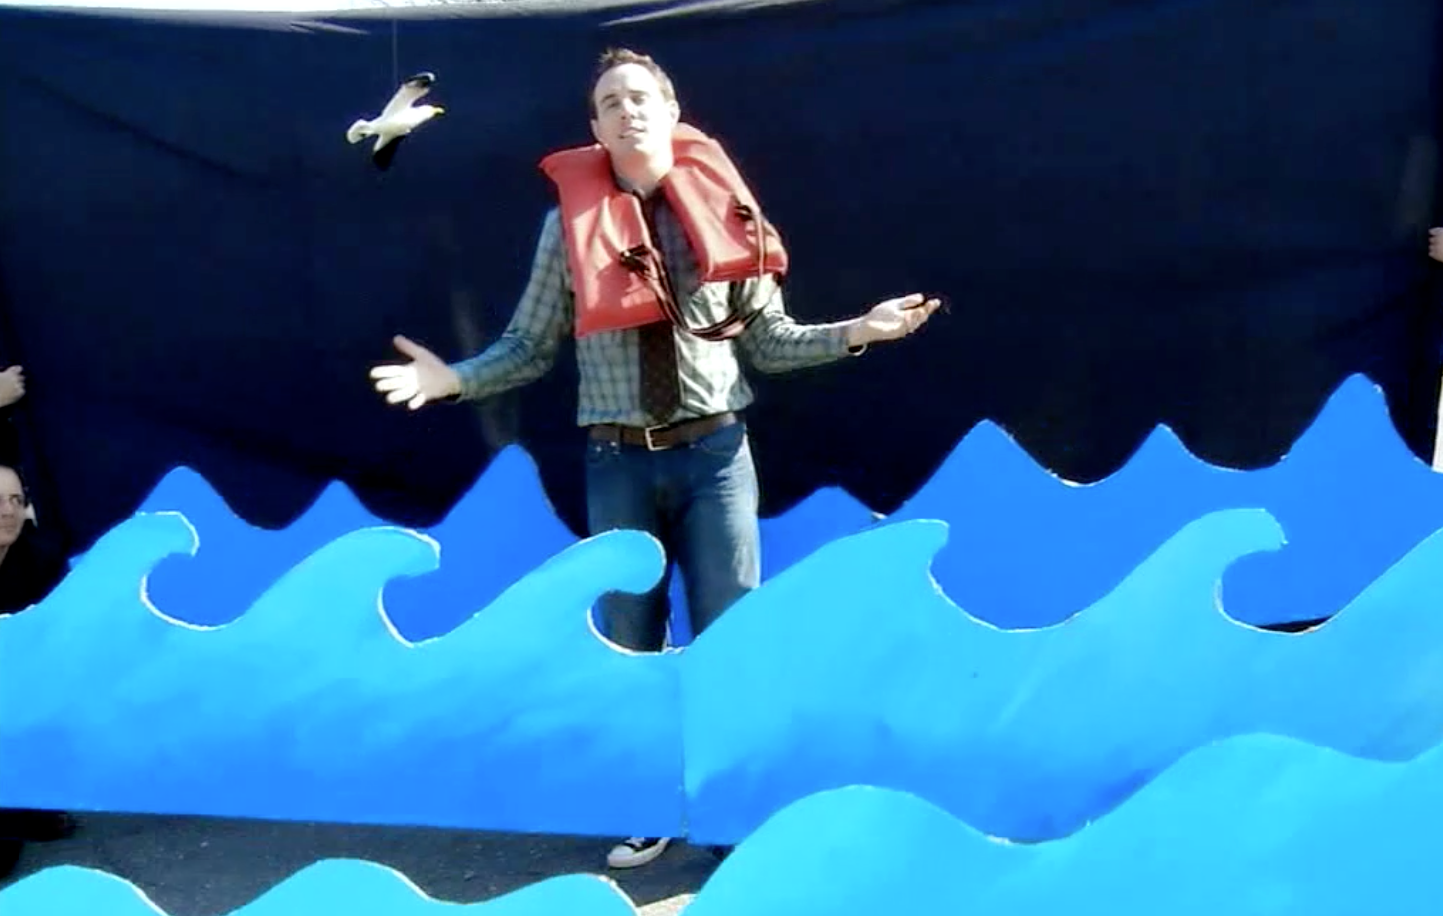
The short video "For Good Measure" explains why scientists turn to satellites to get a worldwide view of rainfall. Filmed at NASA's Goddard Space Flight Center in Greenbelt, Md., with a cast of more than 20 volunteers, the video walks through how rain touches our lives and how scientists plan to improve measurements with the upcoming Global Precipitation Measurement mission.
Getting the Big Picture
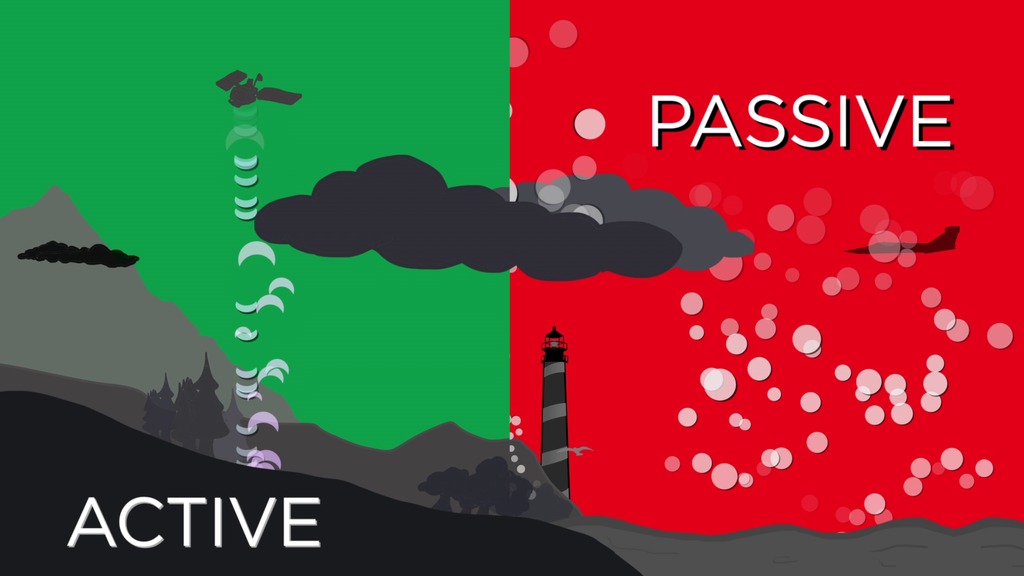
This video discusses why we need remote sensing to study the Earth, and the differences between active and passive remote sensing from satellites. It also gives examples of different types of data NASA satellites collect about the Earth, and some of the applications of that data.
The Data Downpour
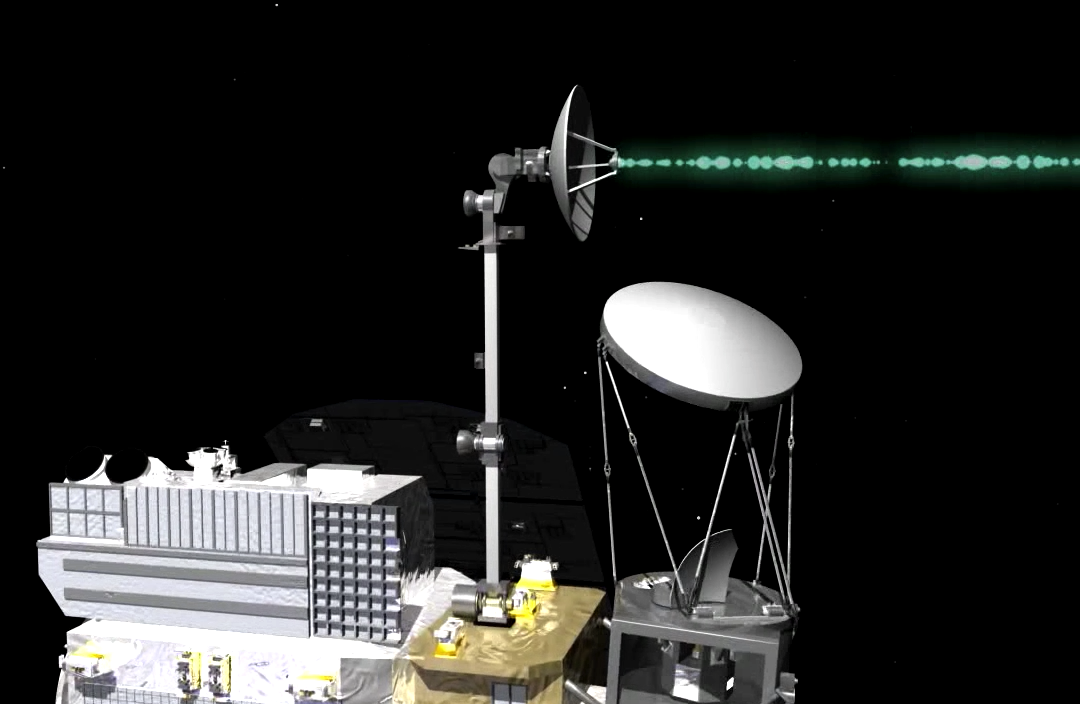
A video describing how the GPM constellation turns observed radiances and reflectivities of global precipitation into data products. The GPM Core Observatory launched in early 2014, but the mission goes beyond data gathering data from one satellite. A constellation of spacecraft from U.S. agencies and other countries, all carrying similar instruments to measure rainfall, contribute data to this global rain map. Compiling observations from these sources into one unified global data set is the job of the Precipitation Processing System at Goddard.