Search
Primary tabs
Search
Your search for "Climate" gave back 165 results.
Primary Topic:
Subtopics:
Type:
Keywords:
Summary:
GPM Application Science Lead, Dr. Dalia Kirschbaum, explains how landslides and floods occur, and how satellite imagery is used in understanding these disasters.
Primary Topic:
Subtopics:
Type:
Summary:
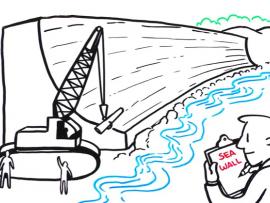
In this IQuest, you will explore resources to help you learn about the Sentinel-6 Michael Freilich satellite, the science behind sea level rise, and the STEM related careers of several of the scientists and engineers involved with this effort.
Primary Topic:
Subtopics:
Type:
Keywords:
Summary:
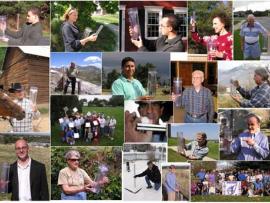
CoCoRaHS is a Citizen Science organization that helps participants collect and share precipitation data. They also assist teachers in learning how to install and use rain gauges with their students. Learn how to collect and submit measurements to CoCoRaHS
Primary Topic:
Subtopics:
Type:
Summary:
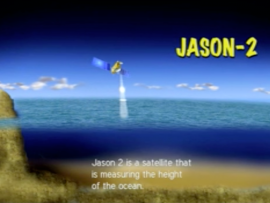
Learn how the satellite, Jason 2, is able to use radar waves to determine the height of sea levels and evaluate the effects of global warming.
Primary Topic:
Subtopics:
Type:
Keywords:
Summary:
The S'COOL Project involves students (ages 5 - 20+) in real science, making and reporting ground truth observations of clouds to assist in the validation of NASA's CERES satellite instruments. Includes lesson plans and other related materials.
Primary Topic:
Subtopics:
Type:
Keywords:
Summary:
This month's NASA Earth Explorer explains what it's like to be face-to-face with one of nature's most powerful storms.
Primary Topic:
Subtopics:
Type:
Keywords:
Summary:
View recent data for air temperature, carbon dioxide, carbon monoxide, sea level, ozone, ice and water using an interactive viewer. You can also follow NASA's satellites and learn how they collect critical data about Earth's atmosphere, land, and oceans.
Primary Topic:
Subtopics:
Type:
Keywords:
Summary:
The activities in this guide will help students understand variations in environmental parameters by examining connections among different phenomena measured on local, regional and global scales.
Primary Topic:
Subtopics:
Type:
Keywords:
Summary:
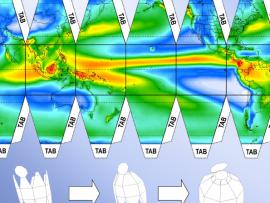
An activity in which students will cut and fold paper to create a 3D sphere which displays precipitation climatology.
Primary Topic:
Subtopics:
Type:
Keywords:
Summary:
Explore the solar heating of the ocean in part one of a series on the water cycle. The animations show multiple views of the solar heating of the oceans, a picture of this first stage of water's cyclical journey from sea to air to land, and back again.


