Search
Primary tabs
Search
Your search for "weather" gave back 165 results.
Primary Topic:
Subtopics:
Type:
Keywords:
Summary:
Learn about precipitation and how clouds are formed. Find out why scientists study clouds and how you can help NASA collect cloud observation data as part of the Students' Cloud Observation OnLine, or S'COOL, Project.
Primary Topic:
Subtopics:
Type:
Keywords:
Summary:
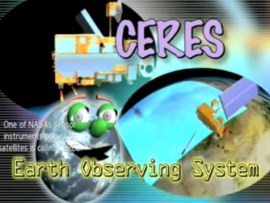
Learn how scientists use a satellite called CERES to study the clouds and monitor Earth's climate changes.
Primary Topic:
Subtopics:
Type:
Standards:
Keywords:
Summary:
In this activity, students will learn about Earth’s climate vital signs. They will use NASA’s Climate Change website to learn about the factors that scientists use to understand changes in our climate.
Primary Topic:
Subtopics:
Type:
Summary:
GPM Application Science Lead, Dr. Dalia Kirschbaum, explains how GPM observes snow, and the importance of understanding snow characteristics and distribution in a changing climate.
Primary Topic:
Subtopics:
Type:
Keywords:
Summary:
This website explores NASA's role in characterizing, understanding and predicting climate variability and change.
Primary Topic:
Type:
Summary:
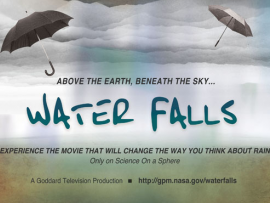
Learn about "Water Falls', the exciting new Science on a Sphere film that tells the story of GPM and the importance of freshwater. Premiering October 2013.
Primary Topic:
Subtopics:
Type:
Keywords:
Summary:
A video describing how the GPM constellation turns observed radiances and reflectivities of global precipitation into data products.
Primary Topic:
Subtopics:
Type:
Standards:
Keywords:
Summary:
A downloadable PDF lesson plan which explores Earth's energy cycle.
Primary Topic:
Subtopics:
Type:
Keywords:
Summary:
This animation uses Earth science data from a variety of sensors on NASA Earth observing satellites as well as cartoons to describe Earth's water cycle and the continuous movement of water on, above and below the surface of the Earth.


