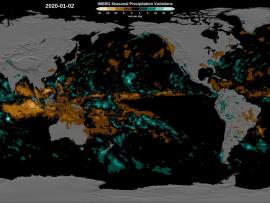
In this article from the summer 2024 edition of The Earth Scientist, learn about NASA's Global Precipitation Measurement mission and the many tools and resources it offers for understanding Earth's water cycle and weather.
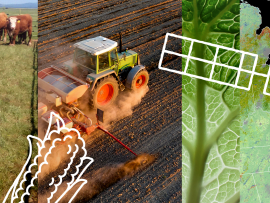
NASA’s Earth observations have a significant impact on the food we eat and drink. The NASA At Your Table campaign creates awareness of the many ways in which these data are being used by a variety of stakeholders to help get food and drink to your table..
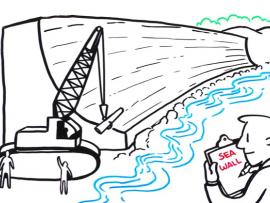
In this IQuest, you will explore resources to help you learn about the Sentinel-6 Michael Freilich satellite, the science behind sea level rise, and the STEM related careers of several of the scientists and engineers involved with this effort.
Using the My NASA Data Literacy Cubes will enhance students exploration of graphs, maps, and datasets to enrich their observations and inferences. The cubes offer an interactive and engaging way for participants to explore graphs, maps, and datasets.
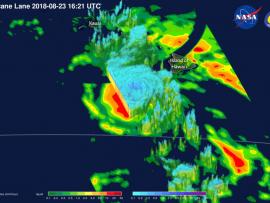
Students will use various visualizations (i.e. images, charts, and graphs) to explore the energy exchange that occurs when hurricanes extract heat energy from the ocean.
Students will analyze surface temperature and solar radiation data to construct explanations about the relationship of seasons and temperature to the amount of solar energy received on Earth’s surface.
This My NASA Data lesson plan takes students through data from the GRACE satellite mission to help them understand where regions around the globe may experience a change in their freshwater availability.