An educational brochure which explores the importance of fresh water to life on Earth and how NASA is monitoring and studying precipitation using satellites like GPM.
This video explains why the size and shape of raindrops in a cloud matters to scientists, and how the Global Precipitation Measurement Mission is able to provide these measurements from space.
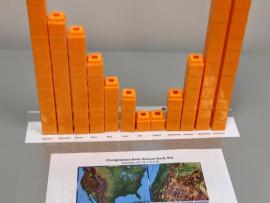
This lesson uses cubes as a way to graph precipitation data to compare the precipitation averages and seasonal patterns for several different locations. There are several variations to accommodate various ages and ability levels.
This web seminar provided a robust understanding on the science behind Earth’s water cycle, while also demonstrating multiple possibilities for infusing water-related concepts into the curriculum.
This data exercise has students look up precipitation ground data and satellite data for a site in Washington State and do a comparison using a data table and a graph. The activity is expected to take about 45 minutes.
You will learn how we measure rain and snow from the ground and from space using satellites, and why we need to check the data using ground validation. This particularly relates to the OLYMPEX Field Campaign.
You will learn how we measure precipitation from the ground and from space using satellites, and why we need to do ground validation of the satellite data. You will also learn about the OLYMPEX Field Campaign.
This short animation from the Community Collaborative Rain Hail and Snow Network shows how decision makers use a variety of data and in-person reports to assess the drought conditions across the United States.


 This is a conceptual image showing how the size and distribution of raindrops varies within a storm. Blues and greens represent small raindrops that are 0.5-3mm in size. Yellows, oranges, and reds represent larger raindrops that are 4-6mm in size. A storm with a higher ratio of yellows, oranges, and reds will contain more water than a storm with a higher ratio of blues and greens.