
5 Year Anniversary of Hurricane Arthur
View fullscreen in STORM Event Viewer
June marks the official start of the Atlantic hurricane season. And although strong tropical cyclones are rare in June in the Atlantic, it will soon be the 5-year anniversary of Hurricane Arthur, which became a tropical depression in very late June 2014 before hitting the Outer Banks of North Carolina as a Category 2 hurricane in early July. As with most storms early in the season, Arthur formed not from a tropical wave moving off the coast of Africa but from an old frontal boundary that stalls off the coast and provides a focus for shower and thunderstorm activity over warm water. With Arthur the process was enhanced by a disturbance that merged with a front that then moved southeast off of the coast of South Carolina. An area of low pressure formed, which then settled north of the Bahamas spawning showers and thunderstorms that could tap into the warm waters of the nearby Gulf Stream.
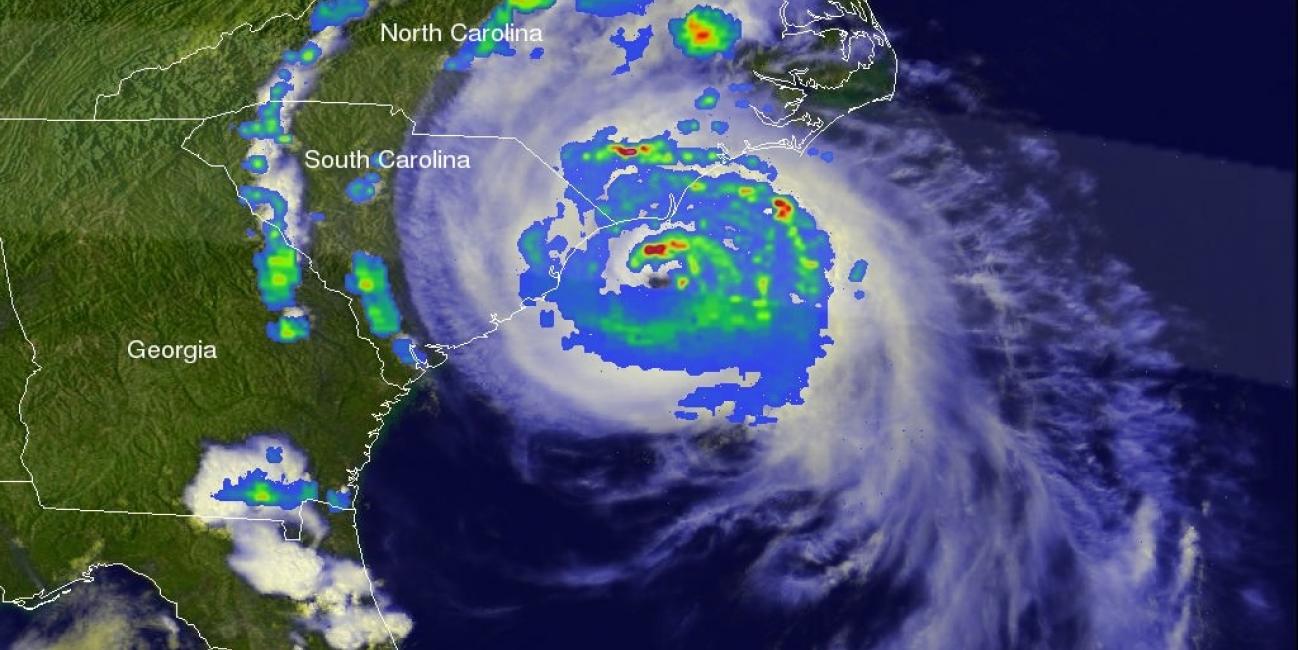
 Instantaneous rain rates from a TRMM overpass of Arthur while it was still in the developing stage and not yet a named storm. Rain rates in the inner swath are from the TRMM PR and those in the outer swath are from the TMI. The image was taken at 1717 UTC (1:17pm EDT) on 30 June 2014. Image courtesy of NASA GSFC.
 TRMM captured the first image at this very stage just hours before Arthur officially became a tropical depression and shows numerous scattered showers starting to wrap around the southern and eastern side of the center of circulation. Over the next few days, the system slowly intensified becoming a tropical storm on July 1st and a hurricane on the 2nd. As it did so, Arthur was drawn northward toward the NC coast by a large trough of low pressure located over the eastern third of the US.
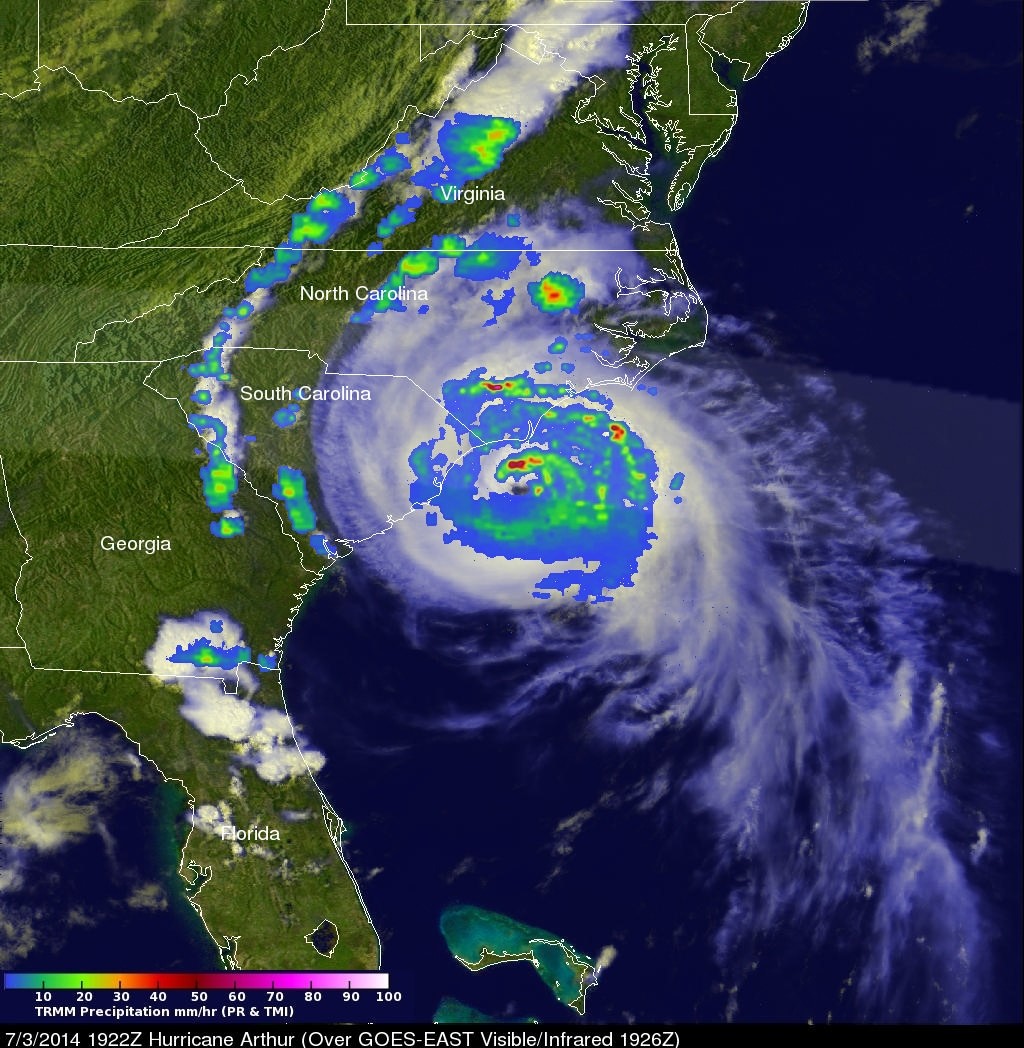 Instantaneous rain rates from a TRMM overpass of Hurricane Arthur as it neared the coast of NC. Rain rates in the inner swath are from the TRMM PR and those in the outer swath are from the TMI. The image was taken at 19:22 UTC (3:22pm EDT) on 3 July 2014. Image courtesy of NASA GSFC.
 Arthur made landfall around 11:15 pm EDT on the evening of the 3rd at Shackleford Banks NC west of Cape Fear as a Category 2 storm with sustained winds of 100 mph. TRMM captured the second image just as the storm was nearing the coast and shows a well-organized hurricane with distinct rain bands wrapping all the way around the center. Although the eyewall is not yet completely closed as evidenced by the rainfall pattern retrieved from TRMM, the TRMM PR does show an area of intense rain associated with a deep convective tower in the northern eyewall (please see the animation), which suggests Arthur was poised for further strengthening if not for the impending landfall. These deep towers are often referred to as “convective bursts”. They release large amounts of latent heat into the storm and are often a good indication of further strengthening when located near the core of the storm.
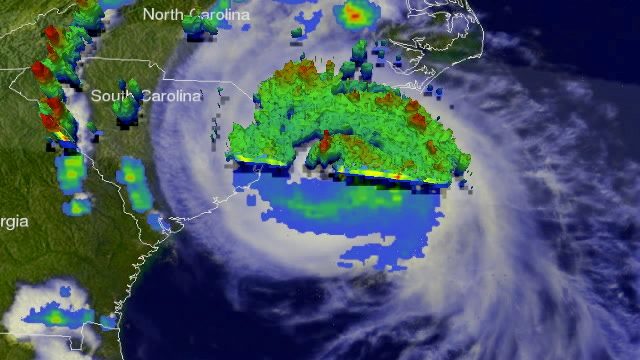 3D flyby of storm top heights measured by the TRMM PR (Precipitation Radar) from a TRMM overpass at 19:22 UTC (3:22pm EDT) on 3 July 2014 of Hurricane Arthur as it neared the coast of NC. Animation produced by Hal Pierce (ret. NASA GSFC/SSAI).
After making landfall, Arthur moved northeast back over water and paralleled the East Coast and transitioned a post tropical cyclone before hitting the Canadian Maritimes with strong winds.
Images produced by Hal Pierce (SSAI/NASA GSFC) and caption by Stephen Lang (SSAI/NASA GSFC)