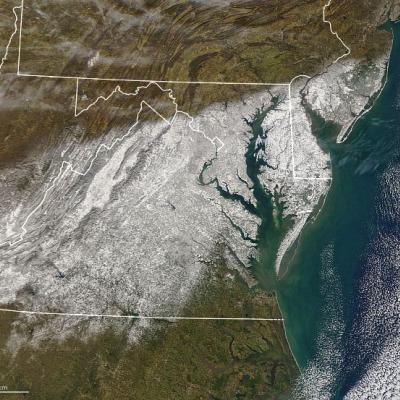
PMM Science Banner

Science Articles

MODIS imagery of the snowstorm in Jan. 2022
The Investigation of Microphysics and Precipitation for Atlantic Coast-Threatening Storms ( IMPACTS ) mission, now in its second year, is flying aircraft into snowstorms in order to improve meteorological models and our ability to use satellite data to predict how much snow will fall and where. NASA and its partners have several satellites that measure precipitation from space, such as the Global Precipitation Measurement (GPM) mission that observes rain and snow around most of the world every three hours. “But satellites can’t tell us a lot about the particles – the actual snowflakes ­– and
Average Precipitation Daytime vs. Nighttime
During the summer, the U.S. Great Plains routinely experiences nighttime thunderstorms unlike anywhere else in the country. These large-scale storms—sometimes spanning entire states—account for more than 40 percent of annual rainfall in some areas. They can bring much-needed rain to farms and help recharge aquifers, but extremely severe events can also destroy fields, homes, and lives. Scientists have been studying the region for decades to learn the underpinnings of this distinct, repetitive weather pattern.
Maps showing the Average Precipitation Rate in Lake Victoria, Africa - Day vs. Night
Lake Victoria is the largest lake in Africa and an economic and food security lifeline for roughly 30 million people living near its shores in Uganda, Kenya, and Tanzania. But it also takes lives. Cyclical, daily weather patterns around the lake create violent nighttime thunderstorms that kill roughly 3,000 to 5,000 fishermen per year. “This is definitely one of the stormiest places on Earth,” said Wim Thiery, a climate scientist at the Vrije Universiteit Brussel who has studied Lake Victoria for several years. “Almost every night, you see these intense thunderstorms and sometimes even water
IMERG Sees a Dry September
Rainfall was scarce across much of the country in the month of September, pushing the eastern and southern thirds of the country into drought conditions. IMERG, the Integrated Multi-satellitE Retrievals for GPM, is a unified satellite precipitation product produced by NASA to estimate surface precipitation over most of the globe.
Observing the Intertropical Convergence Zone with IMERG
The intertropical convergence zone or “ITCZ” roughly forms a band that circumnavigates the Earth near the Equator where the northeast trade winds in the Northern Hemisphere converge with the southeast trade winds in the Southern Hemisphere. Sailors have often referred to it as the “doldrums” due to its generally light winds. Yet, the ITCZ is an important part of the global circulation as it forms the ascending branch of the Hadley circulation. This is ultimately driven by incoming solar radiation, which peaks near the Equator. This warms the air and the ocean, causing warm buoyant air to rise...
How TRMM and GPM Study Latent Heating
Latent heating (LH) arises predominantly from the release of heat associated with the condensation of water vapor into cloud droplets in clouds with active updrafts. Other sources of LH include ice deposition and freezing, while evaporation, melting and sublimation induce cooling, but condensation is the dominant heating term. Like a hot-air balloon, LH can keep air parcels warmer than their surrounding environment and therefore rising. On a large scale, LH is responsible for driving the ascending branch of the Hadley Circulation. LH is also an important component in the dynamics of a regional...
Finding Strong Storms with TRMM & GPM
Spring is severe storms season here in the US, but not everyone has NEXRAD radar coverage; however, NASA’s TRMM and GPM satellites with their onboard radars have made it possible to search the entire global Tropics and midlatitudes and systematically identify areas where there are strong to intense thunderstorms. Researchers now headed by Dr. Chuntao Liu at Texas A&M University have built a comprehensive database of “precipitation features” based on regions of contiguous radar echoes from first the TRMM and now the GPM satellite. These precipitation features can then be mined to locate areas...
TMPA Shows El Niño Conditions in the Pacific
An El Niño that began to form last fall has matured and is now fully entrenched across the Pacific. Changes in sea surface temperatures, or SSTs, brought about by an El Niño affect the atmosphere, resulting in distinctive changes in the rainfall pattern across the Pacific Basin. These changes show up as anomalies or deviations in NASA’s analysis of climatological rainfall. This map shows sea surface temperature (SST) anomalies for the Pacific Basin, shown as degrees Celsius above or below average. Credit: NOAA Climate Prediction Center. In a typical El Niño, warmer than average SSTs off of the...
Top 5 GPM Research Highlights
GPM celebrates its fifth anniversary since launching from Tanegashima Island, Japan on February 27, 2014. This milestone not only marks the launch but also the many scientific research accomplishments that GPM has made in advancing our understanding of precipitation, from light rain to intense thunderstorms, to further our understanding of the water cycle. Here are five of GPM’s most significant research accomplishments and their contributions to weather and climate science in its first five years in space: Snowfall and Cold Season Precipitation An image of GPM’s DPR concept of dual-frequency...
GPM Gets Flake-y
In this video GPM Project Scientist Dr. Gail Skofronick-Jackson explains how scientists can measure the size, shape and distribution of snow particles, layer by layer, in a storm using GPM. The Global Precipitation Measurement mission is an international satellite project that provides next-generation observations of rain and snow worldwide every three hours.
GPM Sees Larsen-C Ice Shelf Separation
Click here to download the video (.mp4) On July 12, 2017, a giant iceberg broke off Antarctica and a variety of satellites have been used to study it ever since. The Global Precipitation Measurement (GPM) Microwave Imager (GMI) instrument can see the ribbon of relatively warm water and ice that separates the newly formed iceberg from the its parent mass of ice, the Larsen C ice shelf. While the iceberg is separated from the parent iceshelf by only a few kilometers, the GMI instrument is sensitive enough to detect the variation in temperature between this relatively warm gap and the colder ice...
Atmospheric River Slams California
After more than four years of drought, Californians may wonder where the current rain is coming from. Using satellites, NASA scientists have a unique view of the sources of precipitation, and how it reaches the western United States. Rain is often carried by narrow tendrils of moisture called atmospheric rivers that occur all over the world, shown here in white. The atmospheric rivers that affect the western United States are known as the Pineapple Express because they transport water vapor from as far south as Hawaii to California. When the moisture reaches land, it is forced up over the...
Monsoons: Wet, Dry, Repeat
Credit: NASA/Goddard/Ryan Fitzgibbons This video is public domain and along with other supporting visualizations can be downloaded from the Scientific Visualization Studio The monsoon is a seasonal rain and wind pattern that occurs over South Asia (among other places). Through NASA satellites and models we can see the monsoon patterns like never before. Monsoon rains provide important reservoirs of water that sustain human activities like agriculture and supports the natural environment through replenishment of aquifers. However, too much rainfall routinely causes disasters in the region...
Measures Raindrop Sizes From Space
Not all raindrops are created equal. The size of falling raindrops depends on several factors, including where the cloud producing the drops is located on the globe and where the drops originate in the cloud. For the first time, scientists have three-dimensional snapshots of raindrops and snowflakes around the world from space, thanks to the joint NASA and Japan Aerospace Exploration Agency Global Precipitation Measurement (GPM) mission. With the new global data on raindrop and snowflake sizes this mission provides, scientists can improve rainfall estimates from satellite data and in numerical...
OLYMPEX Successfully Grabs the Rains
NASA has finished its campaign to study extreme rain, snow and winds of the Olympic National Forest. Scientists Walt Petersen of NASA Marshall and Robert Houze of the University of Washington narrate this inside look at the Olympic Mountain Experiment (OLYMPEX) field campaign. During the campaign, NASA and its partners gathered precipitation data through both ground and airborne instruments around the Olympic Peninsula in Washington State. They measured the abundance and variety of precipitation including light rain, heavy thunderstorms, and snowfall in the coastal forest. The data collected...
OLYMPEX Scientists in the Field
From November 10 through December 21, NASA and university scientists are taking to the field to study wet winter weather near Seattle, Washington. With weather radars, weather balloons, specialized ground instruments, and NASA's DC-8 flying laboratory, the science team will be verifying rain and snowfall observations made by the Global Precipitation Measurement (GPM) satellite mission on a NASA-led field campaign, The Olympic Mountain Experiment, or OLYMPEX. Rachael Kroodsma is the instrument scientist for the CoSMIR on board NASA's DC-8 airborne laboratory as part of the OLYMPEX field...
Pacific NW Campaign to Measure Rain & Snow
From Nov. 10 through Dec. 21, NASA and university scientists are taking to the field to study wet winter weather near Seattle, Washington. With weather radars, weather balloons, specialized ground instruments, and NASA's DC-8 flying laboratory, the science team will be verifying rain and snowfall observations made by the Global Precipitation Measurement (GPM) satellite mission. Credits: NASA's Goddard Space Flight Center The Pacific Northwest was chosen because of its frequent and persistent winter rain and snowfall. On average 100 to 180 inches of precipitation fall a year, making it one of...
Media are invited to go behind the scenes of a comprehensive field campaign focused on yielding new insights into global precipitation at a special event on Nov. 11, 2015.  NASA's DC-8 deploys to Iceland on a mission to study Arctic polar winds. NASA's DC-8 flying laboratory will be featured as part of a special media event on Nov. 11, 2015 focused on the Olympic Mountain Experiment (OLYMPEX), an Earth science campaign aimed at validating Global Precipitation Measurement. Credits: NASA Photo / Carla Thomas
Media are invited to go behind the scenes of a comprehensive field campaign focused on yielding new insights into global precipitation at a special event on Nov. 11, 2015. NASA's DC-8 flying laboratory will be featured as part of a special media event on Nov. 11, 2015 focused on the Olympic Mountain Experiment (OLYMPEX), an Earth science campaign aimed at validating Global Precipitation Measurement. Credits: NASA Photo / Carla Thomas Held in collaboration with the University of Washington, NASA's Olympic Mountain Experiment (OLYMPEX) is an Earth science campaign aimed at validating Global...
Global Precipitation Measurement (GPM) Is In Position to Watch Effects of 2015’s El Niño
Since late in 2014, scientists in many different disciplines (including meteorologists, climate scientists, physical and biological oceanographers, hydrologists, and geologists) have been watching a slow-to-develop El Niño even in the tropical Pacific Ocean. After teasing observers with conditions that did not quite meet El Niño criteria 1 , the event finally reached official El Niño status in March and April, and is now expected to become a powerful event lasting into the next Northern Hemisphere winter. If these conditions, typified by warm sea surface temperatures (SST) in the tropical...
How Does NASA Study Hurricanes?
Hurricanes are the most powerful weather event on Earth. NASA’s expertise in space and scientific exploration contributes to essential services provided to the American people by other federal agencies, such as hurricane weather forecasting. The National Oceanic and Atmospheric Administration and the National Hurricane Center (NHC) use a variety of tools to predict these storms’ paths. These scientists need a wealth of data to accurately forecast hurricanes. NASA satellites, computer modeling, instruments, aircraft and field missions contribute to this mix of information to give scientists a...
A Tale of Two Extremes: Rainfall Across the US
The United States has seen a tale of two extremes this year, with drenching rains in the eastern half of the country and persistent drought in the west. A new visualization of rainfall data collected from space shows the stark contrast between east and west for the first half of 2015. The accumulated precipitation product visualized here begins on Jan. 1, 2015, and runs through July 16, 2015. This visualization shows the heavy rainfall throughout Northern Texas and across Oklahoma as well as the drought in Southern California. Credits: NASA Goddard's Scientific Visualization Studio Download...
California “Rain Debt” Equal to Average Full Year of Precipitation
California's accumulated precipitation “deficit” from 2012 to 2014 shown as a percent change from the 17-year average based on TRMM multi-satellite observations. Credits: NASA/Goddard Scientific Visualization Studio A new NASA study has concluded California accumulated a debt of about 20 inches of precipitation between 2012 and 2015 -- the average amount expected to fall in the state in a single year. The deficit was driven primarily by a lack of air currents moving inland from the Pacific Ocean that are rich in water vapor. In an average year, 20 to 50 percent of California's precipitation...
IPHEx Campaign Demonstrates Two New Instruments
Three Radars are Better than One Putting three radars on a plane to measure rainfall may seem like overkill. But for the Integrated Precipitation and Hydrology Experiment field campaign in North Carolina recently, more definitely was better. During the field campaign, NASA's ER-2 research aircraft flew out of Robins Air Force Base in Georgia. HIWRAP is under the wing in the black compartment; the Cloud Radar System is under the other wing and is not visible; and the EXRAD radar is in the extended nose cone. Image Credit: NASA / Gerry Heymsfield The three instruments, developed by the High...
NASA Widens 2014 Hurricane Research Mission
NASA's airborne Hurricane and Severe Storm Sentinel or HS3 mission, will revisit the Atlantic Ocean for the third year in a row. Image Credit: NASA's Goddard Space Flight Center/Ryan Fitzgibbons Download this video in HD formats from NASA Goddard's Scientific Visualization Studio During this year's Atlantic hurricane season, NASA is redoubling its efforts to probe the inner workings of hurricanes and tropical storms with two unmanned Global Hawk aircraft flying over storms and two new space-based missions. NASA's airborne Hurricane and Severe Storm Sentinel or HS3 mission, will revisit the...
NASA Begins IPHEx Field Campaign
Rain, ice, hail, severe winds, thunderstorms, and heavy fog – the Appalachian Mountains in the southeast United States have it all. On May 1, NASA begins a campaign in western North Carolina to better understand the difficult-to-predict weather patterns of mountain regions. The field campaign serves as ground truth for measurements made by the Global Precipitation Measurement (GPM) mission's Core Observatory. GPM is an international satellite mission to observe rain and snow around the world. The advanced instruments on the GPM Core Observatory satellite, launched Feb. 27, provide the next...
Ground validation radars.
The Global Precipitation Measurement (GPM) Core Observatory, launched on Feb. 27, 2015, from Tanegashima Space Center in Japan, will help advance our understanding of Earth's water and energy cycles, improve the forecasting of extreme events that cause natural disasters, and extend current capabilities of using satellite precipitation information to directly benefit society. The GPM mission will provide unprecedented data on rain and snowfall. The science instruments on the GPM Core Observatory will provide data that will yield the greatest clarity on rain and snow yet gathered from orbiting...
PMM Article Image
When asked to picture the shape of raindrops, many of us will imagine water looking like tears that fall from our eyes, or the stretched out drip from a leaky faucet. This popular misconception is often reinforced in weather imagery associated with predictions and forecasts. Raindrops are actually shaped like the top of a hamburger bun, round on the top and flat on the bottom. A new video from the Global Precipitation Measurement mission explains why. This short video explains how a raindrop falls through the atmosphere and why a more accurate look at raindrops can improve estimates of global...
PMM Article Image
On a Wednesday afternoon in June, a severe storm outbreak spawned huge thunderstorms across Iowa and western Illinois. NASA's Polarimetric precipitation radar was in place to scan the storms as they swept through the region. "It's unbelievable out here," Walt Petersen of NASA's Wallops Flight Facility in Virginia wrote in an email dispatch from Traer, Iowa. There, two NASA radars were stationed as part of the Iowa Flood Studies field campaign, which Petersen led, for the Global Precipitation Measurement, or GPM, mission. Caption: A cluster of rain gauges and soil moisture sensors deployed in...
IFloodS Observes Severe Storm Outbreak
Development of low storm clouds in the atmospheric mixing layer over the NPOL and D3R radars on June 12, 2013 at ~12:00 p.m. CDT. Credit: Walt Petersen /NASA . On Wednesday afternoon, June 12, a severe storm outbreak developed and moved across central and eastern Iowa, and then western Illinois, spawning huge thunderstorms and several tornadoes. NASA's Polarimetric (NPOL) precipitation radar, currently deployed in Iowa as part of the Iowa Flood Studies field campaign for the Global Precipitation Measurement mission, rapidly scanned these storms as they moved across the state. NPOL capturing...
PMM Article iFloods Banner
By Ellen Gray, NASA Goddard Space Flight Center Original www.nasa.gov Feature (published 4/30/13) Ground data now being collected in northeastern Iowa by the Iowa Flood Studies experiment will evaluate how well NASA's Global Precipitation Measurement (GPM) mission satellite rainfall data can be used for flood forecasting. GPM is an international satellite mission that will set a new standard for precipitation measurements from space, providing worldwide estimates of precipitation approximately every three hours. The GPM Core Observatory, provided by NASA and mission partner the Japan Aerospace...
A misty mountaintop in The Smoky Mountains
By Lisa-Natalie Anjozian , NASA Goddard Space Flight Center Original www.nasa.gov Press Release (published 4/24/12) If you walk into a cloud at the top of a mountain with a cup to slake your thirst, it might take a while for your cup to fill. The tiny, barely-there droplets are difficult to see, and for scientists they, along with rain and snow, are among the hardest variables to measure in Earth Science, says Ana Barros, professor of engineering at Duke University. As part of the Science Team for NASA's Precipitation Measurement Missions (PMM) that measure rainfall from space, Barros and her...
NASA's D3R radar at the GCPEx field campaign.
By Ellen Gray, NASA Goddard Space Flight Center Original www.nasa.gov Feature (published 1/31/12) Predicting the future is always a tricky business -- just watch a TV weather report. Weather forecasts have come a long way, but almost every season there's a snowstorm that seems to come out of nowhere, or one that's forecast as 'the big one' that turns out to be a total bust. In the last ten years, scientists have shown that it is possible to detect falling snow and measure surface snowpack information from the vantage point of space. But there remains much that is unknown about the fluffy white...
GCPEx logo on falling snow background
By Ellen Gray, NASA Goddard Space Flight Center Original www.nasa.gov Press Release (published 1/12/12) Beginning Jan. 17, NASA will fly an airborne science laboratory above Canadian snowstorms to tackle a difficult challenge facing the upcoming Global Precipitation Measurement (GPM) satellite mission -- measuring snowfall from space. GPM is an international satellite mission that will set a new standard for precipitation measurements from space, providing next-generation observations of worldwide rain and snow every three hours. It is also the first mission designed to detect falling snow...

Hide Date