
Observing the ITCZ with IMERG
The intertropical convergence zone or “ITCZ” roughly forms a band that circumnavigates the Earth near the Equator where the northeast trade winds in the Northern Hemisphere converge with the southeast trade winds in the Southern Hemisphere. Sailors have often referred to it as the “doldrums” due to its generally light winds. Yet, the ITCZ is an important part of the global circulation as it forms the ascending branch of the Hadley circulation. This is ultimately driven by incoming solar radiation, which peaks near the Equator. This warms the air and the ocean, causing warm buoyant air to rise and a band of lower pressure to form. This in turn leads the trade winds to converge, which also forces warm moist air to rise. As it does, the moisture in the air condenses. This releases latent heat, which further drives the upward motion, but it also forms clouds and precipitation, revealing the ITCZ as a band of rainfall that wraps around the Earth near to the Equator. IMERG, the Integrated Multi-satellitE Retrievals for GPM, is a unified satellite precipitation product produced by NASA to estimate surface precipitation over most of the globe. With IMERG, precipitation estimates from the GPM core satellite are used to calibrate other satellite microwave and IR estimates. Then by merging the estimates from multiple satellites, surface precipitation maps can be produced half-hourly at 0.1o horizontal resolution.
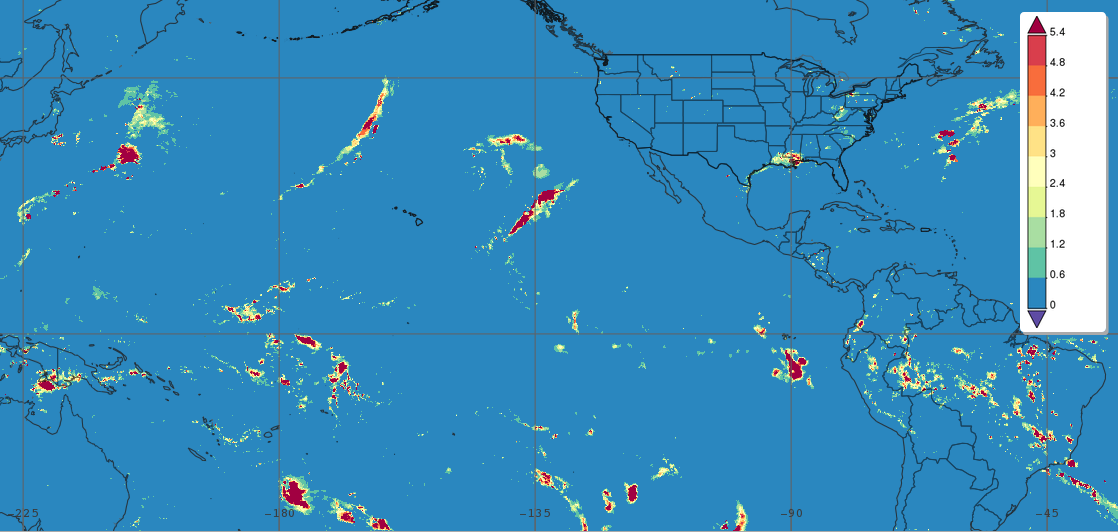 Instantaneous surface precipitation rates (mm/hr) estimated from the NASA IMERG satellite precipitation product for 00:00 UTC 01 March 2019.
 The first figure shows instantaneous IMERG surface precipitation rates (nearly all rain) at 00:00 UTC 01 March 2019. Though certain rainfall characteristics are discernable such as the elongated rain features associated with frontal systems in the midlatitudes and the widespread pop up type storms covering Brazil, based on this single snap shot, it is nearly impossible to identify the ITCZ. Rain areas in the equatorial Pacific are widely scattered and very localized with areas of heavy rain separated by vast areas of no rain. However, as the rainfall estimates are averaged in time, the ITCZ starts to take shape.
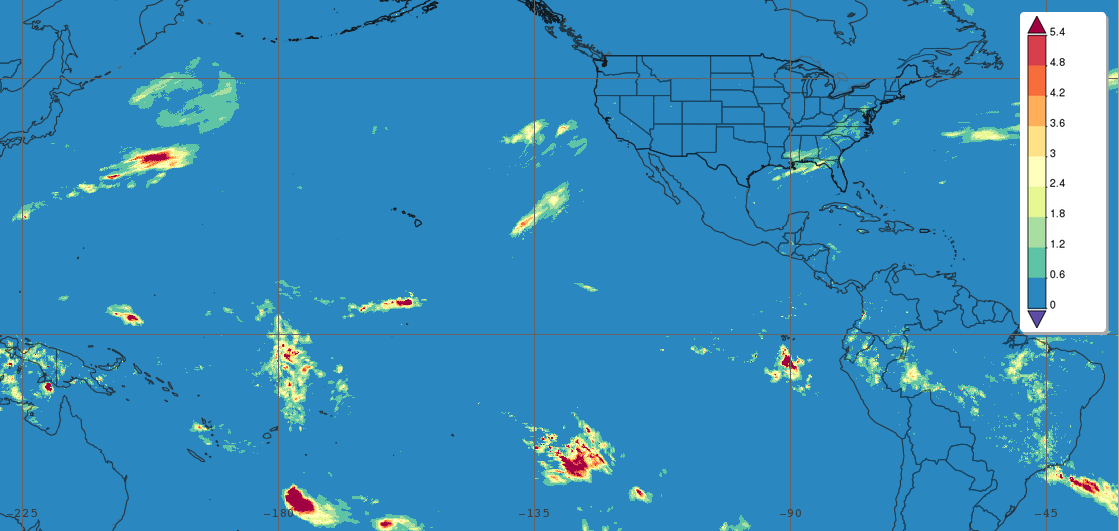 One-day average surface precipitation rates (mm/hr) estimated from the NASA IMERG satellite precipitation product for 01 March 2019.
 If rainfall is averaged over just one day (2nd figure), the pattern is still very similar to the instantaneous.
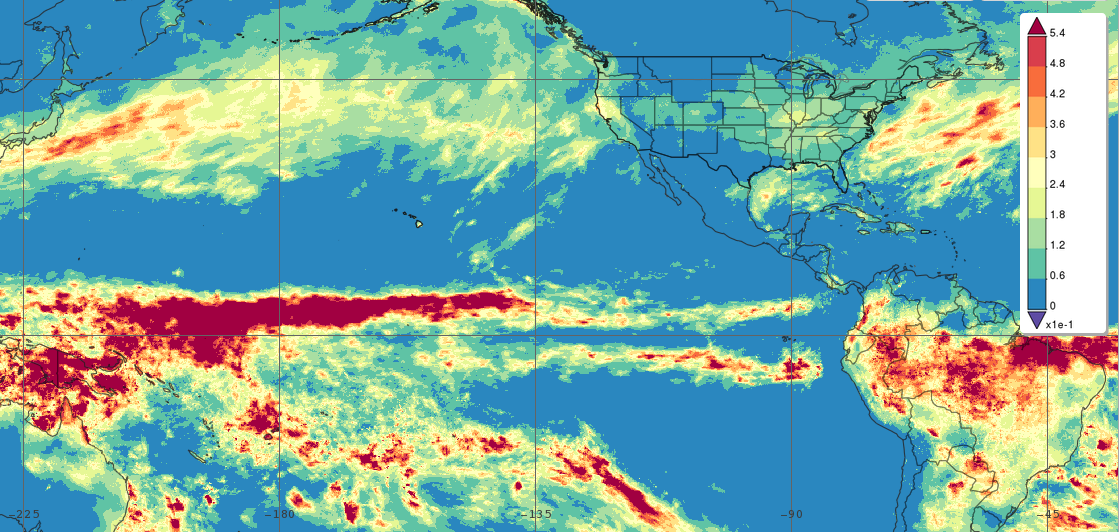
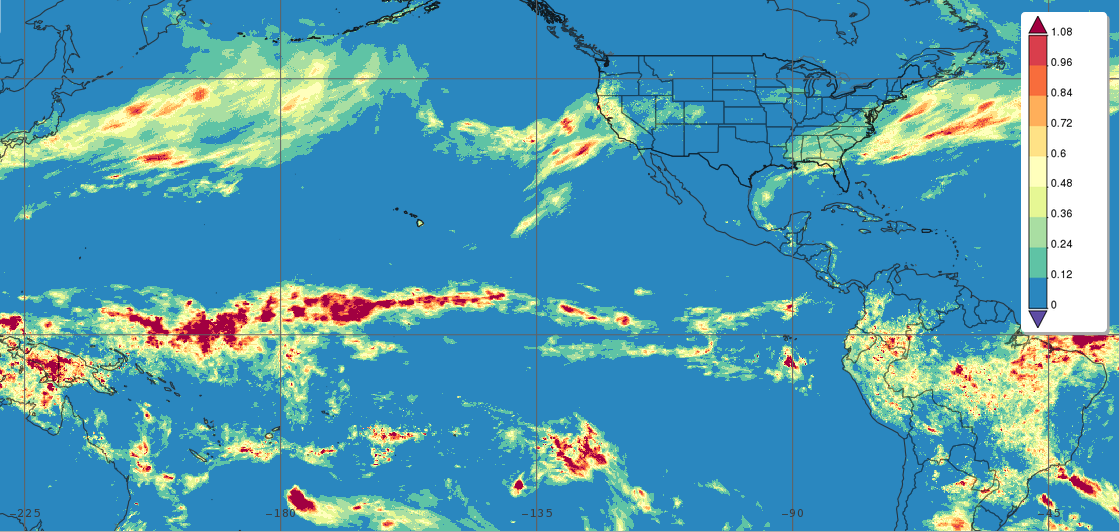 One-week average surface precipitation rates (mm/hr) estimated from the NASA IMERG satellite precipitation product for 1-7 March 2019.
 But, if rainfall is average over a week (3rd figure), a distinctive banding feature begins to emerge near the Equator, which is the hallmark of the ITCZ. At this time scale, there is still a lot of variation between the East and Central Pacific. Although the ITCZ is a broad scale, long-term feature, it is still subject to seasonal and sub-seasonal variations. The heavier rainfall in the Central Pacific during this one-week period (1-7 March 2019) coincides with the occurrence of a Central Pacific El Niño wherein anomalously high sea surface temperatures (SSTs) in the Central Pacific lead to enhanced rainfall there.
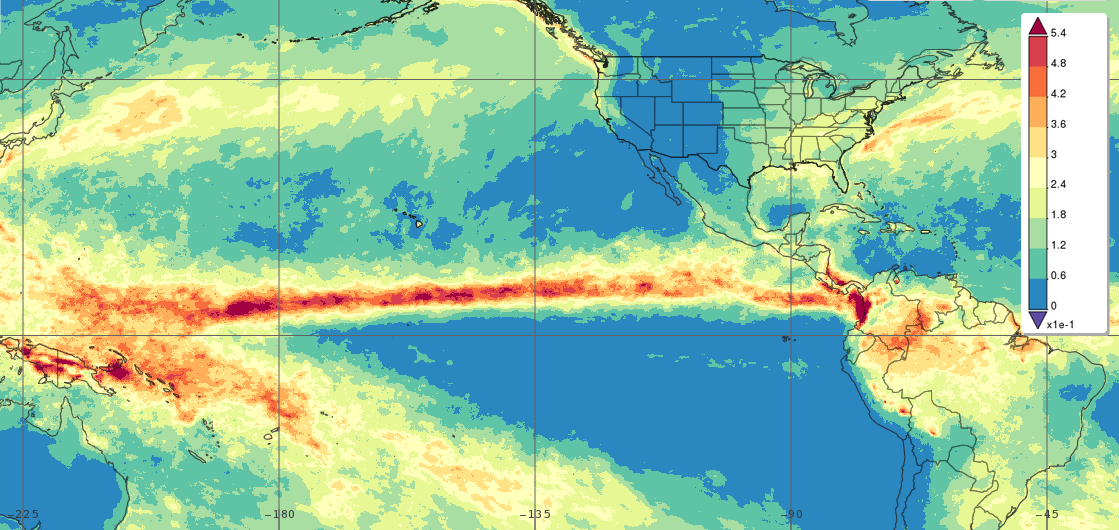
 One-month average surface precipitation rates (mm/hr) estimated from the NASA IMERG satellite precipitation product for March 2019.
 On a monthly time-scale (4th figure), the banding features become even more prominent and a little more uniform, though there is still a substantial difference in the magnitude of rainfall between the Eastern and Central Pacific. Also evident is a double-ITCZ structure in the East Pacific with two separate bands north and south of the Equator. This feature is most common in the Northern Hemisphere spring as is the case here where the monthly average is for March 2019. On this time scale, in addition to the rainfall associated with the midlatitude storm track between Japan and the US West Coast, there is another feature beginning to emerge in the Southern Hemisphere known as the South Pacific Convergence Zone or SPCZ. It extends southeastward from the ITCZ east of Australia.
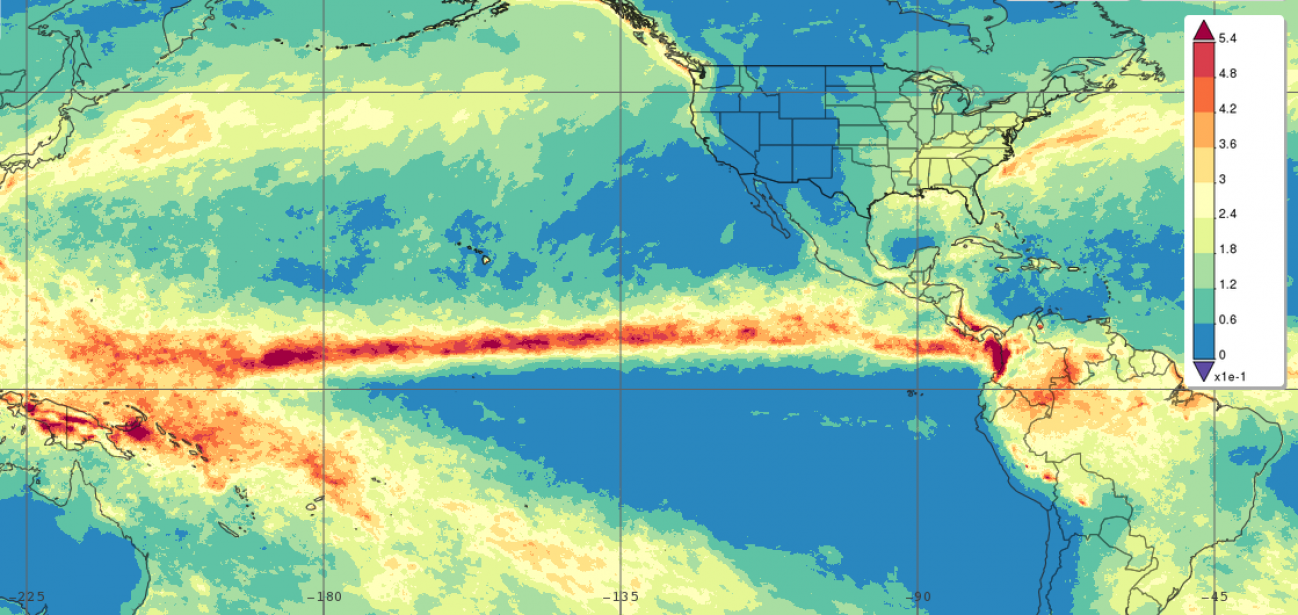
 One-year average surface precipitation rates (mm/hr) estimated from the NASA IMERG satellite precipitation product for April 2018 to March 2019.
 Finally, on a yearly time scale (5th figure), a distinct and remarkably uniform rain band appears just north of the Equator clearly marking the mean location of the ITCZ and highlighting its importance in the general circulation of the atmosphere.
Story and Images by Steve Lang (NASA GSFC). Data are jointly curated by the GES DISC and PMM, and plots are produced by Giovanni