Seasonal Precipitation Variations
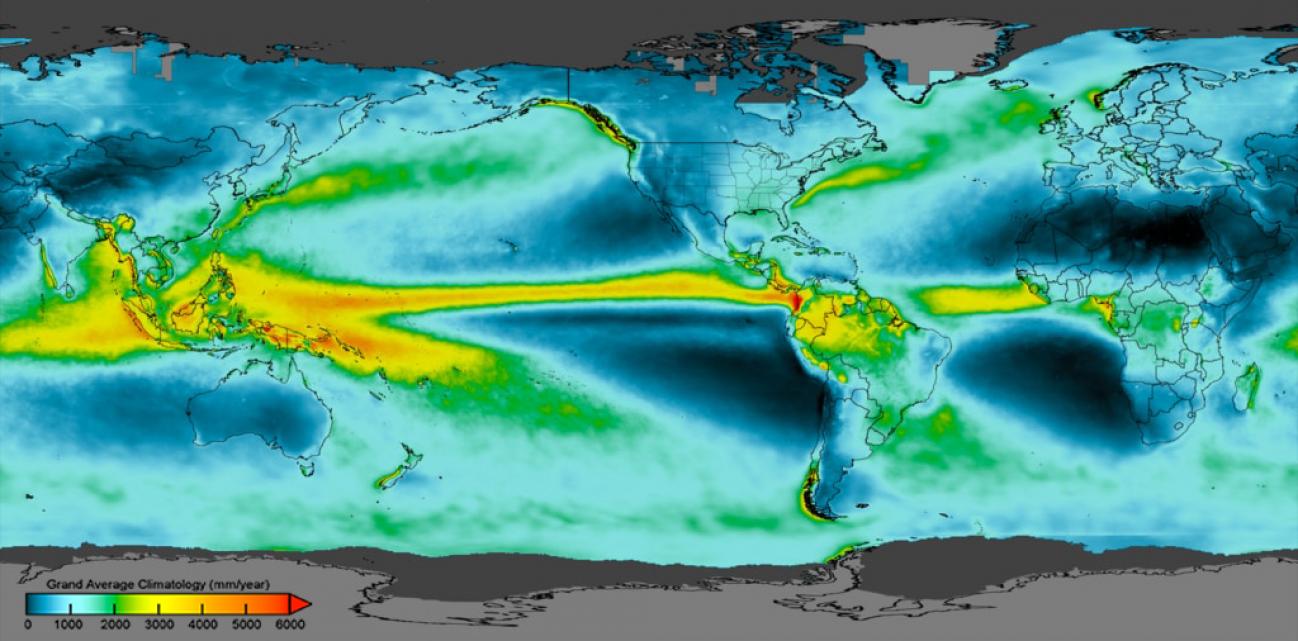
By comparing the amount of precipitation that falls in shorter timespans with the total average precipitation derived from IMERG's 20 year record we can generate maps of precipitation anomalies, or how much recent rainfall conditions deviate from the norm. Using these datasets we can quantify the extremeness of severe dry or wet periods around the world, which helps communities better plan and prepare for droughts, floods, fire season and other extreme weather.
The visualizations on this page were generated using IMERG V07B Final Run.
2015-2016 El Niño
In June 2015 to May 2016, the planet experienced one of the strongest El Niño events on record. El Niño and La Niña are opposite phases of how the climate system varies internally due to complex atmosphere and ocean interactions. In the 2015-2016 El Niño, rainfall is reduced over the western Pacific due to shifting circulation patterns, leading to forest fires in Indonesia and droughts in the Philippines. The shift in circulation resulted in more rain over the central Pacific. This is unlike the typical El Niño, which usually brings increased precipitation to the eastern Pacific regions such as California. With a global coverage, IMERG allows researchers to better understand the precipitation characteristics of these different types of El Niño.
Download this video (right-click -> Save As)
2010-2011 La Niña
Coming out of a weak El Niño event in 2009, the climate system entered a strong La Niña in 2010–2011. This La Niña event brought substantial rainfall to the western Pacific, leading to flooding in Australia. La Niña also affects the weather around the world. For example, hurricane activity was above average in the Atlantic.
Download this video (right-click -> Save As)
Continental U.S. 2018 - 2019
2018 and 2019 are one of the wettest period on record over the United States. Substantial amounts of rain fell over the eastern half of the country in 2018 and the first-half of 2019. These rains broke historical records in many mid-Atlantic regions, with 2018 ranking as the wettest year in many cities. While the increased precipitation was beneficial to California in alleviating the drought conditions, it also led to catastrophic flooding along the Mississippi River in late spring of 2019, exacerbating the rivers already swollen from snowmelt.
Download this video (right-click -> Save As)
Australia 2019 - 2020
In early 2020, Australia suffered one of the most severe bushfires on record. While bushfires are part of the Australian landscape, widespread and persistent conditions of low rainfall in late 2019 and January 2020 exacerbated the intensity and extent of the bushfires. Relief came in February 2020 with the arrival of heavy rainfall, though this caused some localized flooding at the same time. The toll was devastating, with 19 million hectares of land burnt, 5,900 buildings destroyed, and an estimated 1 billion animals killed.\
Download this video (right-click -> Save As)
South Asia Monsoon Season 2019
Agriculture in South Asia is reliant on rainfall from the monsoon, but its timing, duration, and intensity can vary from year to year. In 2019, the rainfall over India from the monsoon is the highest in 25 years, though there is some variability between different regions. The excessive rain led to severe flooding, with more than 200 deaths and millions displaced. An accurate forecast for the monsoon season is of immense societal benefit, but it remains a challenge.
Download this video (right-click -> Save As)

