
Measuring Latent Heating in Storm Systems
Latent heating (LH) arises predominantly from the release of heat associated with the condensation of water vapor into cloud droplets in clouds with active updrafts. Other sources of LH include ice deposition and freezing, while evaporation, melting and sublimation induce cooling, but condensation is the dominant heating term. Like a hot-air balloon, LH can keep air parcels warmer than their surrounding environment and therefore rising. On a large scale, LH is responsible for driving the ascending branch of the Hadley Circulation. LH is also an important component in the dynamics of a regional-scale circulation known as the Madden-Julian Oscillation or MJO, which forms in the Indian Ocean and propagates eastward through the Maritime Continent bringing first enhanced and then suppressed rainfall over a period of about 30 to 60 days. LH is what fuels and intensifies hurricanes and tropical cyclones. And on a small scale, just like the hot-air balloon, LH is responsible for the growth of individual convective clouds and thunderstorms. However, LH is very hard to measure directly.
The solution is to “retrieve” LH by using a cloud-resolving model or CRM to bridge cloud characteristics that can be observed or inferred with a satellite or radar, such as rain intensities, storm top heights, and the amount of rain in convective cores versus surrounding weaker rain rate areas known as stratiform rain (stratiform and convective areas tend to have their own distinctive LH profiles). Using these common cloud characteristics, which can be both observed via satellite and modeled with a CRM, it is possible to map the LH simulated within the CRM to what a satellite like TRMM or GPM sees. Algorithms that are developed to do this mapping are commonly known as “latent heating” algorithms.
One of the very first latent heating algorithms was the Goddard Convective-Stratiform Heating (or CSH) algorithm, which was developed and is still maintained, updated and utilized at NASA Goddard in support of GPM. With the CSH algorithm, it is possible to obtain 3D estimates of LH across the tropics (as well as midlatitudes) over the life of the satellite to study its characteristics in relation to a variety of atmospheric circulations.
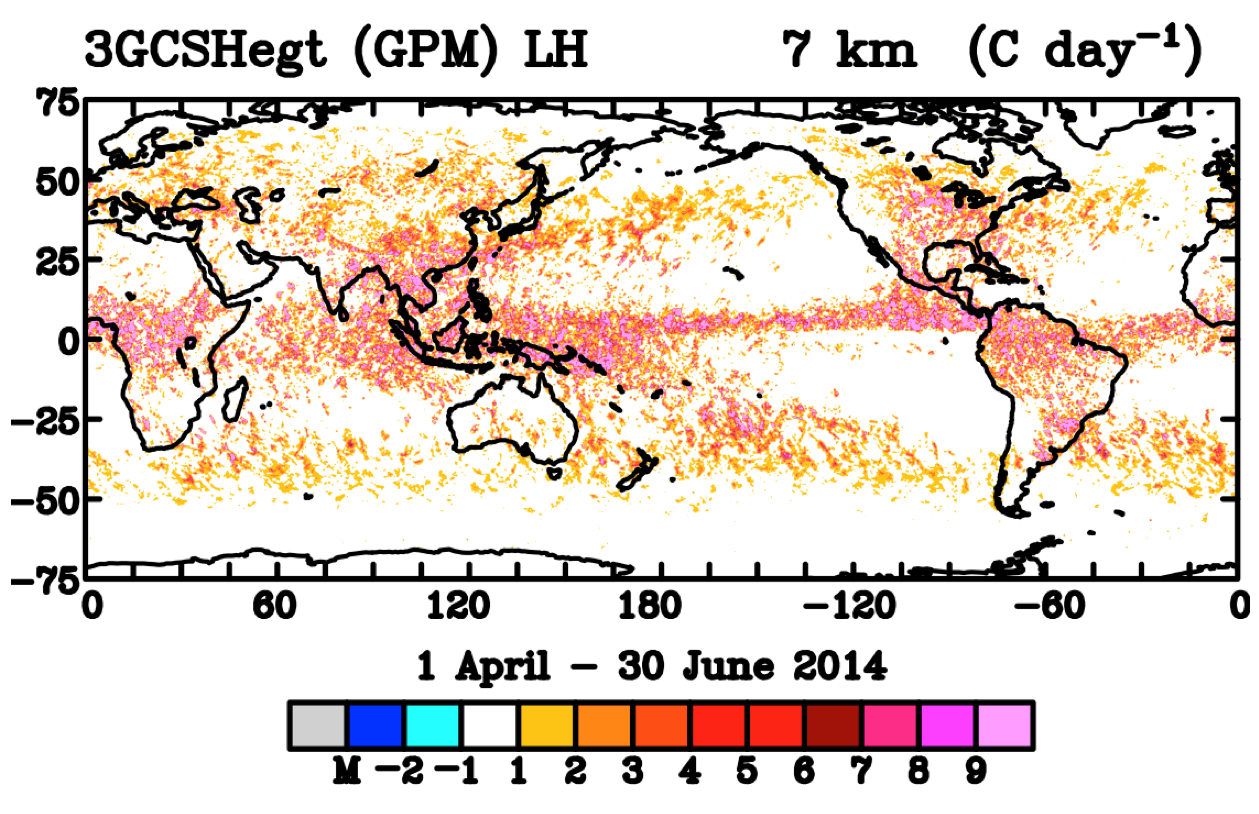
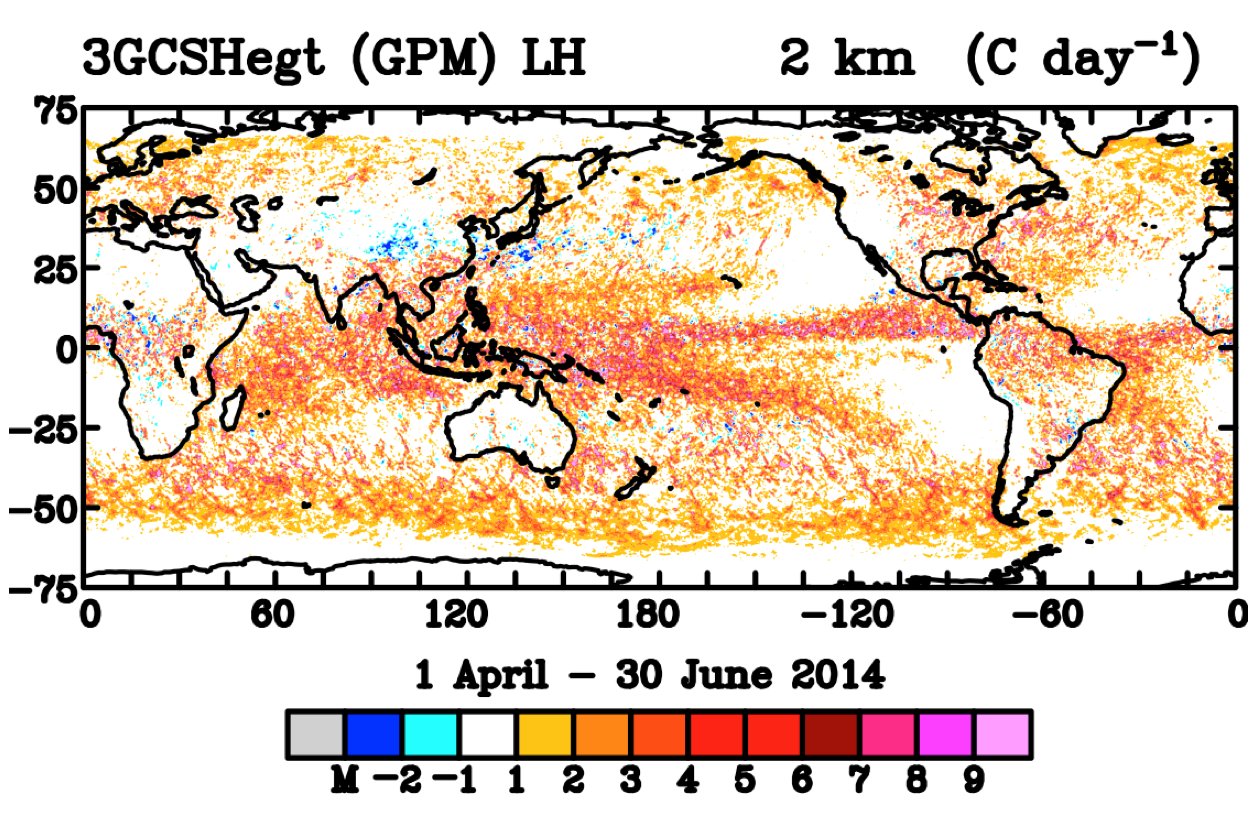
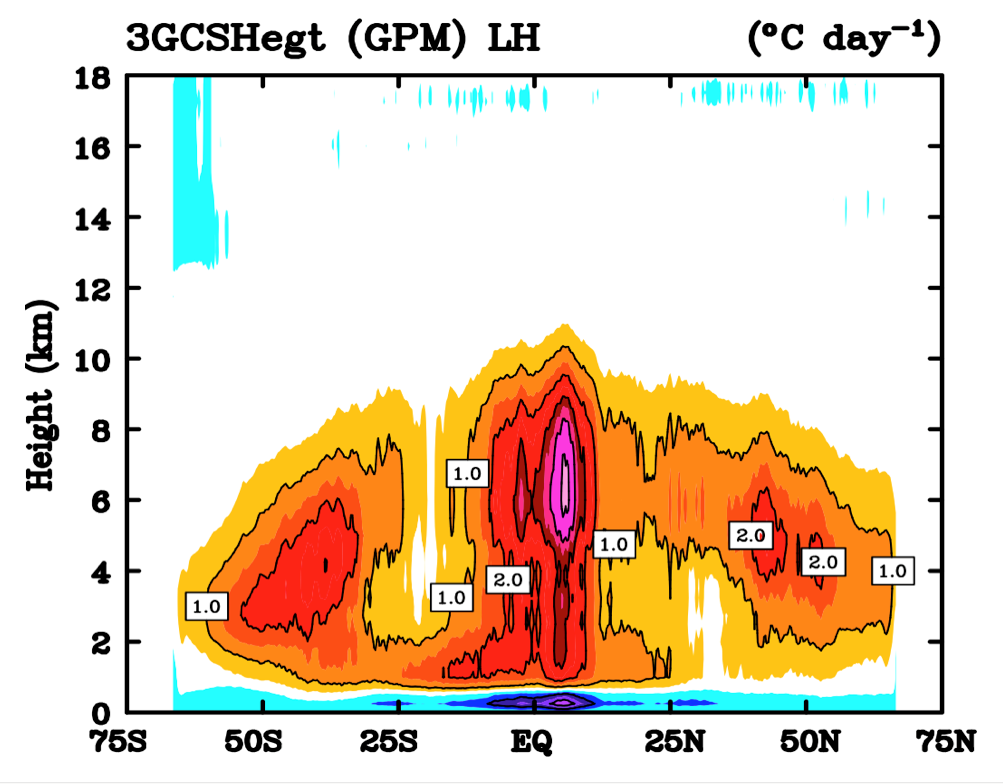
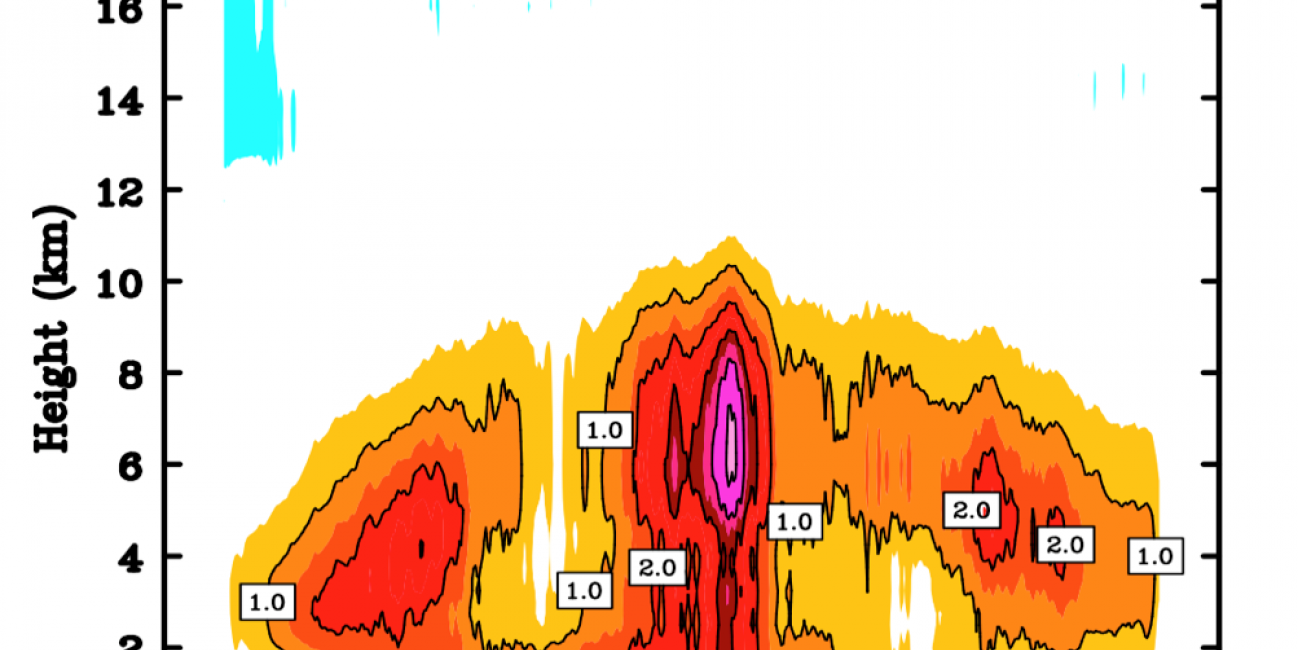
The images above show the three-month average (April-May-June 2014) latent heating derived from the Goddard Convective-Stratiform Heating algorithm at a height of 7 km (top panel) and 2 km (middle panel) using GPM satellite data over the GPM satellite domain. The bottom panel shows a corresponding cross section of zonal-average heating for the same period. Deep intense LH just north of the Equator coincides with the Inter-tropical Convergence Zone and the ascending branch of the Hadley Circulation. Images from NASA GSFC using data from https://pmm.nasa.gov/
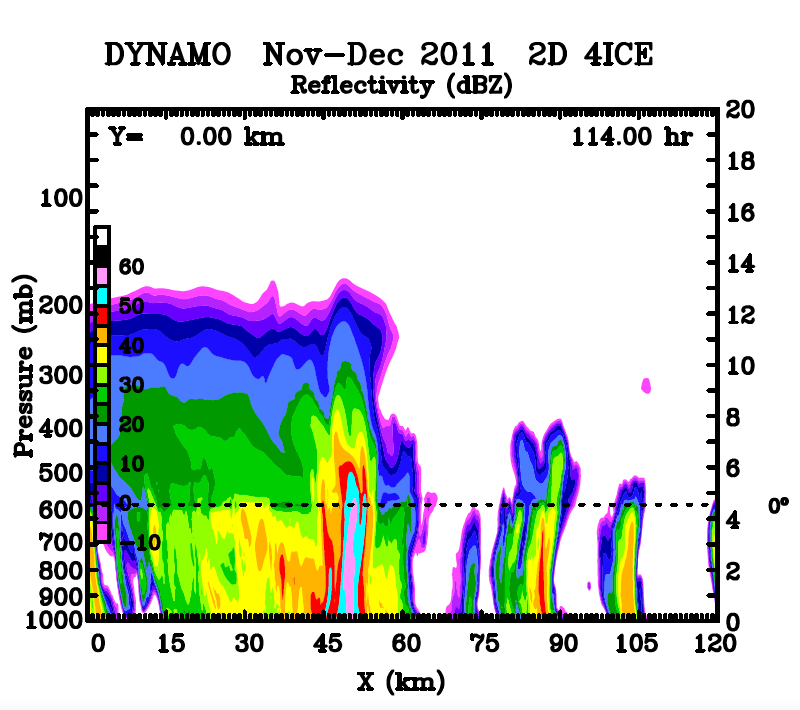
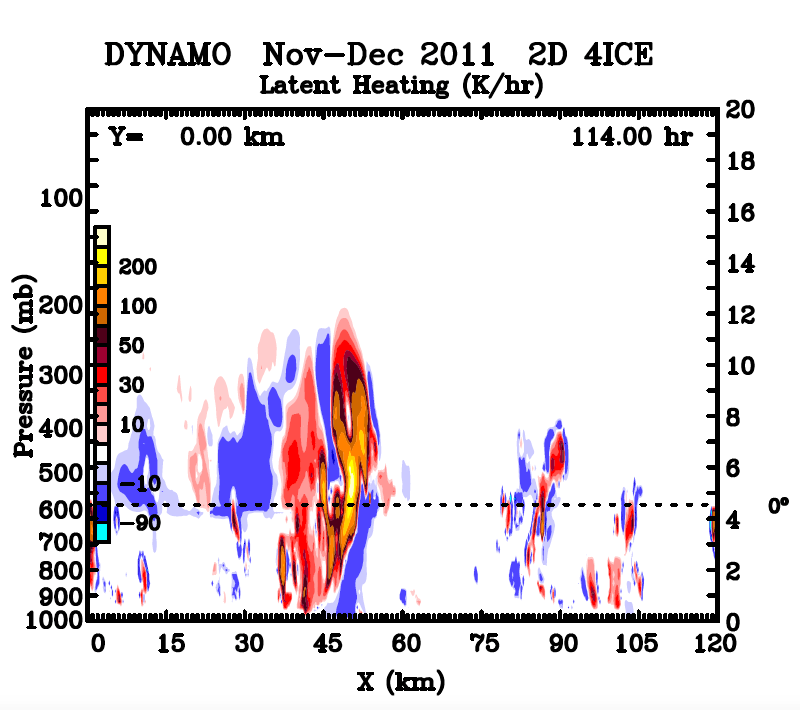
The above images show radar reflectivities (dBZ, top panel) for a convective cloud system simulated over the Indian Ocean with the Goddard Cumulus Ensemble model, a cloud-resolving model, using data from the 2011 DYNAMO (Dynamics of the MJO) field campaign. Corresponding simulated latent heating/cooling rates are shown in the bottom panel. Areas in warm colors show heating mainly from cloud condensation associated with active updrafts in convective cores while cool colors show areas of cooling due primarily to rain evaporation at low levels or cloud evaporation along cloud edges. Even though LH is a primary driver for many larger-scale systems, because LH originates from and varies according to cloud-scale processes, its retrieval is best suited using cloud-resolving model simulations. Images from NASA GSFC.