
Hurricane Isaias Impacts the US East Coast
Hurricane Isaias Precipitation, Sea Surface Temperature, and Wind History, August 5, 2020
From July 29 to August 5, 2020, NASA’s IMERG algorithm observed tropical storm Isaias’ rainfall over the Caribbean and large parts of the Eastern US. This animation shows the IMERG rain rates in green shading as Isaias tracked from the tropical Atlantic into the Caribbean, then northward along the Atlantic coast and into New England. The yellow line shows the location of Isaias' low-pressure center, as tracked by the National Hurricane Center and smoothed in time here for the animation.
Several factors contribute to the heavy precipitation along Isaias' path. Warm sea surface temperatures (SSTs), for example, are known to strongly affect tropical cyclones. The movie displays SSTs from NOAA’s OISST data product, which is a daily map of SST estimated from infrared measurements from satellites built by NASA and operated by NOAA. SST values here are smoothed in time for ease of viewing; actual hourly values may differ. SSTs were warm all along Isaias’ path and well above levels that scientists have agreed will support storm development in the tropics, shown here in pink-to-red colors to indicate SSTs greater than a conservative value of 28 degrees Celsius (82 F).
On August 3, as Isaias re-intensified from a tropical storm back to a Category-1 hurricane before making landfall over North Carolina, it passed over particularly warm waters with temperatures greater than 29.5 degrees Celsius. Some of those warm waters were located along the Gulf Stream, a strong ocean-water current that travels northward along Florida's east coast, then northeastward into the Atlantic (seen here as a pink-red streak). Hurricanes can intensify when passing over the warm waters of the Gulf Stream, as heat and moisture are transferred from the ocean’s surface to the lower atmosphere, providing favorable conditions for storm development.
Following Isaias' August 4 landfall, SSTs near the coasts of Florida, Georgia, and the Carolinas had cooled by as much as 2 degrees Celsius, compared to previous days. This cooling results from several processes: the storm extracts heat from the ocean surface, the dense cloud cover blocks the sun from heating the ocean surface, and the winds mix cooler water from the deep ocean up to the surface. Meanwhile, Isaias gained speed after making landfall and rapidly moved northward through the mid-Atlantic region and New England.
A major influence on the storm track is the horizontal wind pattern several miles up, often taken to be the wind speed at the 500 hectopascal (hPa) pressure level. The movie shows this 500-hPa speed with gray-black arrows, computed by NOAA’s GFS weather model analysis. The movie smooths these 6-hourly wind estimates in time and removes wind arrows near the center of the storm. The largest arrows here correspond to a horizontal wind speed of about 33 meters per second (~74 mph).
By performing this multiple-data-source study of storms like Isaias, NASA contributes to our understanding of the Earth system processes that affect our lives. Animation and caption by Jason West (NASA/PPS), updated on 11 August 2020.
Hurricane Isaias Precipitation History, July 29 to August 4, 2020
This animation shows IMERG rain rates (blue-yellow shading) and accumulations (green shading) observed from July 2 to August 4, 2020 along Tropical Storm Isaias’ track from the tropical Atlantic into the Caribbean and then northward along the Atlantic coast. The red line shows the location of the center of Isaias, as tracked by the National Hurricane Center and then smoothed in time for the animation. Parts of the Bahamas received over 30 centimeters (~1 foot) of rainfall during Isaias’ passage, where it made landfall on August 1 as a Category 1 hurricane. After that, Isaias dropped back to tropical-storm strength. Isaias briefly regained its Category 1 status before making landfall over North Carolina and weakening again to a tropical storm. The U.S. East Coast saw some areas receive over 7.5 centimeters (~3 inches) by 13:30 UTC (9:30am ET) on August 4, 2020, while the storm was still passing through the mid-Atlantic region.
Hurricane Isaias over the US East Coast on August 4, 2020
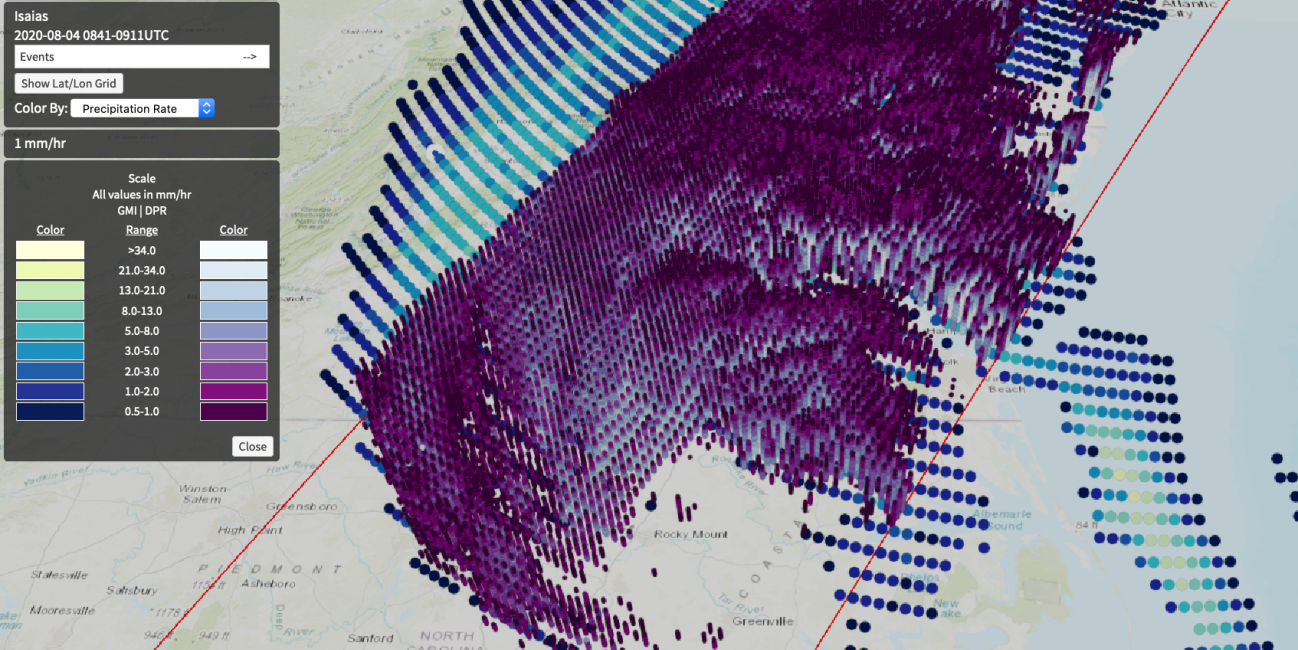
GPM flew over Tropical Storm Isaias early in the morning of August 4, 2020, a few hours after making landfall over North Carolina as a briefly re-intensified Category 1 hurricane. GPM observed rainfall across the entire mid-Atlantic region, extending through New England, during this overpass. The DPR instrument observed rain rates in excess of 50 millimeters/hour (~2 inches/hour) near Richmond, VA, and parts of the Delmarva Peninsula. The GPM Event Viewer, shown above, allows you to interactively examined the GPM satellite's overflights of storms such as Hurricane Isaias on August 4, 2002. In the Event Viewer, click on the question-mark icon to get instructions on how to navigate around within the viewer.
Hurricane Isaias East of Florida on August 2, 2020
After forming into a tropical storm in the eastern Caribbean, Isaias crossed over Hispaniola and back into the western Atlantic heading northwest towards the Bahamas. During this time, Isaias strengthened into a Category 1 hurricane before then passing through the southern and central Bahamas. As it crossed Andros Island in the central Bahamas, Isaias also came under the effects of southwesterly wind shear, which together with the land interaction caused Isaias to weaken back to a strong tropical storm. This animation follows Isaias into the central Bahamas using NASA’s IMERG rainfall product. With IMERG, precipitation estimates from the GPM core satellite are used to calibrate precipitation estimates from microwave and IR sensors on other satellites to produce half-hourly precipitation maps at 0.1 degree horizontal resolution. After it crossed Andros Island, Isaias was overflown by the GPM core satellite itself at 09:11 UTC (5:11 am EDT) on the morning of Sunday August 2nd, which is detailed in the second part of the animation. Here rainfall rates derived directly from the GPM Microwave Instrument (or GMI) and Dual-Polarization Radar (or DPR) provide a detailed look into Isaias. GPM shows a large area of heavy rain (shown in red) covering the northern Bahamas. GPM also shows that this rain is located almost entirely northeast of Isaias’ center with very little rain on the western side of the storm. This highly asymmetric structure reflects both the effects of the wind shear as well as Isaias’ lack of intensity and hence ability to wrap precipitation around to the western side of the circulation. At the time of the GPM overpass, Isaias’ maximum sustained winds were reported at 65 mph by the National Hurricane Center, making it a strong tropical storm. Isaias would go onto regain hurricane intensity due to the warm waters of the Gulf Stream before making landfall on the southern coast of North Carolina.
Credits: Imagery generated by Jason West and the Goddard SVS. Captions by Jason West and Steve Lang.