

Hurricane Sally brings Extremely Heavy Rain to the Northern Gulf Coast
The northern Gulf Coast has seen its share of storms this busy hurricane season. At the end of August, then Tropical Storm Marco brought heavy rains to parts of the Florida Panhandle while western Louisiana took a direct hit from the much more powerful Category 4 Hurricane Laura. Now, just over 3 weeks since Laura made landfall, the northern Gulf Coast was struck again, this time by Hurricane Sally. Though not as powerful as Laura, the still rather strong Sally behaved more like Marco. But, while Marco was largely sheared apart with most of the rain well northeast of the center as it slowed near the coast, Sally was still intensifying and had a much larger and more developed rain field, leading to rainfall totals on the coast roughly 3 times that of Marco.
Sally started as a tropical depression (TD # 19), which formed from a wave of low pressure, on the afternoon of September 11th in the western Bahamas. The system continued westward and was still a tropical depression when it came ashore near Miami during the early morning hours of the 12th. The depression moved across south Florida and emerged back over the open waters of the southeast Gulf of Mexico late on the morning of the 12th. By early afternoon, it was a tropical storm and named Sally. However, despite the warm waters, Sally was slow to intensify as northwesterly wind shear prevented the system from really organizing after emerging from land. By this time, Sally was moving northwestward in response to a high pressure ridge northeast of the system over the Carolinas. The 13th saw Sally continuing to make its way steadily northwestward through the eastern Gulf of Mexico in the direction of southeast Louisiana. Despite some bursts of convection, Sally remained a tropical storm. With the wind shear abated, additional convection allowed Sally to intensify into a hurricane late on the morning of the 14th. At this time, Sally was moving at just 6 mph as it neared the southwestern edge of the weakening area of high pressure
NASA combined data from multiple satellites to estimate the rainfall from Hurricane Sally in near-realtime at half-hourly intervals from September 11-17, 2020. This animation shows rainfall rates (blue/yellow shading) and rainfall accumulations (green shading) from NASA's IMERG algorithm, overlaid on shades of white/gray cloud data from NOAA infrared satellite instruments. The multi-colored line shows Sally's track based on National Hurricane Center advisories, with orange indicating hurricane strength winds. Download this video (right-click -> "Save As")
Sally continued to intensify and by late in the afternoon had reached Category 2 intensity with sustained winds reported at 100 mph by the National Hurricane Center (NHC). By now the center was just about 100 miles from the mouth of the Mississippi and outer rain bands were starting to come ashore in the Florida Panhandle. During the overnight hours of the 14th, Sally’s forward speed dropped to just 2 mph and remained there throughout the entire day of the 15th. However, a slowly approaching trough over the central US started to turn Sally towards the north. Sally’s intensity also dropped off during the day on the 15th but by evening was beginning to rebound. At 10:00 pm CDT, the center was located just 60 miles southwest of Pensacola. During the early morning hours of the 16th, the central pressure continued to fall as the storm continued to creep to the north-northeast towards the coast between 2 and 3 mph.
According to the National Hurricane Center (NHC), Sally finally made landfall at 4:45 am CDT near Gulf Shores, Alabama as a Category 2 storm with sustained winds of 105 mph. By mid-morning on the 16th, Sally was finally beginning to accelerate forward in response to a deepening trough over the central US and high pressure building over and off of the northeastern US. Sally weakened as it made its way through the Florida Panhandle and into southeastern Alabama where it merged with a frontal system.
Rain rates along Sally's track periodically exceeded 1 inch/hour near its core (yellow shading), and combined with its slow speed, led to high accumulations along the Gulf Coast. By 6:30pm CT (2330 UTC) on Sep. 17, IMERG had estimated total accumulations along the southern Alabama coastline and western Florida Panhandle exceeding 16 inches in some locations. NOAA rain-gauge observations were broadly consistent with the IMERG accumulations. After Sally weakened on Sep. 17, it continued traveling northeastward, leaving significant rainfall accumulations across the southeast U.S.
Hurricane Sally's Rainfall In Context
One way to put a storm into context is to compare its precipitation to the average annual accumulation at that location. The IMERG multi-satellite precipitation algorithm estimates that Hurricane Sally brought over 20 inches of precipitation to the coast of Florida's Panhandle during the 7 days ending September 18, 2020, at 0000 UTC. That accumulation was equivalent to 25% to 33% of that area's average annual precipitation. This area is indicated in purple on the left half of the image.
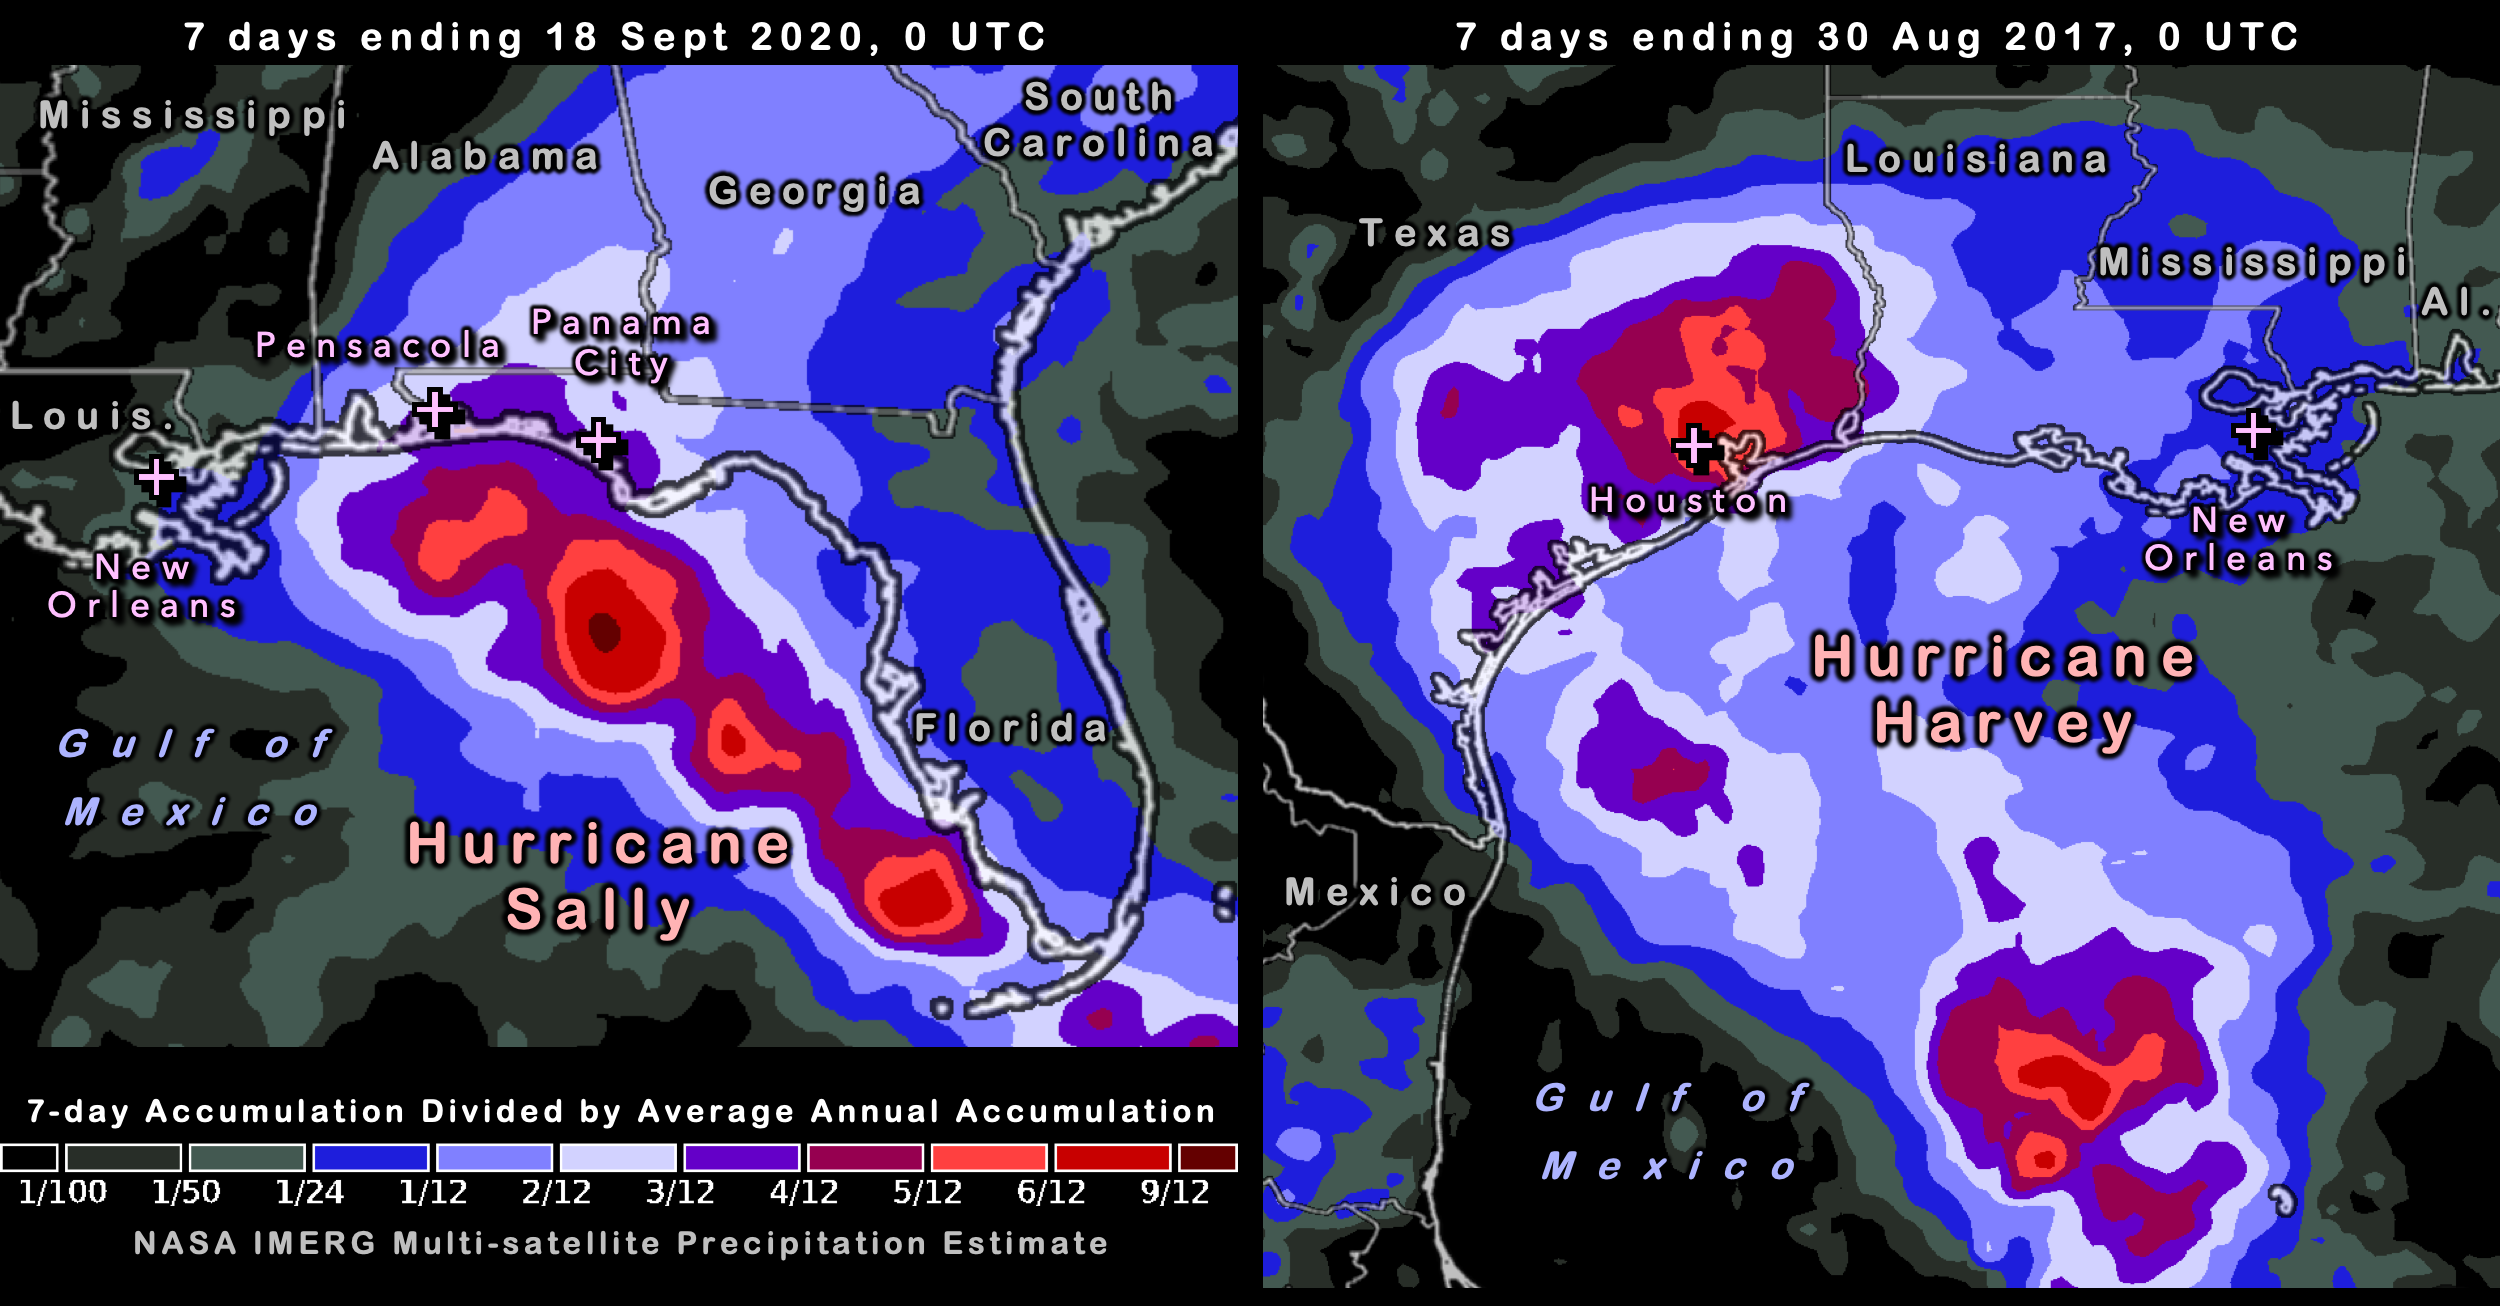
The coast of Florida's Panhandle is the wettest area along the entire US East Coast and Gulf Coast. It receives approximately 60 to 68 inches of precipitation in an average year, based on 19 years of estimates made by the IMERG algorithm.
When it comes to hurricane flooding along the Gulf Coast, Hurricane Sally does not top Hurricane Harvey which made landfall in late August, 2017. Like Sally, Harvey also dumped over 20 inches of rainfall, but over a larger area that included a major metropolitan area. Specifically, this area of southeastern Texas includes Houston, Texas, a city that typically averages approximately 55 to 60 inches of precipitation a year. In Houston, the 7-day accumulation from Hurricane Harvey was 50% to 75% of the city's average annual accumulation. This area is indicated in red on the right half of the image. Houston area flooding contributed to Hurricane Harvey being one of the most costly hurricanes in US history.
Our ability to interpret near real-time estimates of precipitation over both land and ocean is assisted by the availability of a reference data set of 19 years of global precipitation estimates made by the same IMERG algorithm.
Animation by Jason West and Imagery by Owen Kelley (NASA GSFC).
Text by Steve Lang, Jason West, and Owen Kelley (NASA GSFC).