
Atmospheric Rivers Bring Heavy Rain, Flooding to California
A pair of powerful atmospheric river events brought heavy precipitation across much of coastal California this week, resulting in record rainfall totals, extensive flooding, numerous landslides, hurricane-force winds, and power outages. These types of atmospheric river events that impact the U.S. West Coast are also known as the “Pineapple Express” due to their transport of moisture up from the Tropics originating around Hawaii.
The first event had the greatest impact on northern and central California. It was initiated when a large low-pressure trough located in the northeast Pacific intensified and formed a strong upper-level low pressure center off the northern Pacific Coast. This allowed strong, low-level, southwesterly cyclonic winds to pump moisture onto the coast of northern and central California on Jan. 31 and Feb. 1. The second event, which began on Feb. 4, had the greatest impact on the southern half of the state. A reinforcing upper-level trough approached the California coast further south, resulting in the strongest, most persistent onshore flow occurring from the Bay Area southward. Both events impacted large parts of California, including the Sierra Nevada mountains which received significant snowfall over the course of both events.
Download video (right-click -> "Save As")
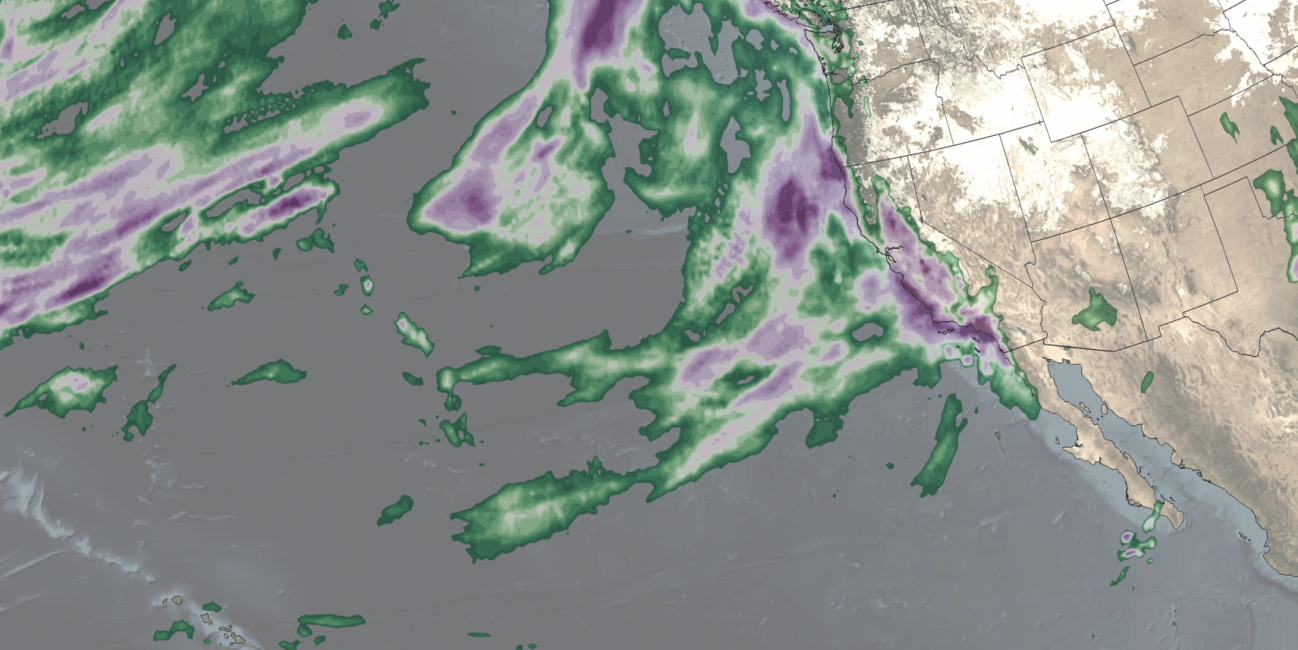
The above animation of surface rainfall estimates from NASA’s IMERG precipitation product begins on Jan. 29 at 4:00 pm PST (Jan. 30, 00:00 UTC) and shows the evolution of these two atmospheric river events as they impacted the U.S. West Coast. The animation begins with the development of a large counterclockwise cyclonic swirl over the northeast Pacific associated with the first event, which makes its way eastward towards the coast. A large band of precipitation extending down towards the Hawaiian Islands wraps around the eastern side of the storm before impacting the West Coast.
The second half of the animation shows the formation and movement of the second cyclone and its accompanying rainbands. This system is more elongated and oriented further south but still extends down into the Tropics. IMERG shows the heaviest accumulations (on the order of 4 inches or more, shown in purple) along the coast around the Oregon border, and from just south of the Bay Area extending down along the coast and into the Los Angeles Basin. Significant accumulations are also evident through central California along the front side of the Sierra Nevada.
Numerous daily rainfall records were broken because of these two events. The National Weather Service reported that Los Angeles received a two-day rainfall total of 7.03 inches on the Feb. 4 and 5, making it the third wettest two-day total in that region ever, and equivalent to half of their annual average.
Credits:
Animation by Jason West (NASA GSFC, PPS, KBR)
Story by Steve Lang (SSAI / NASA GSFC) and Jacob Reed (Telophase / NASA GSFC)