
Calvin Becomes First Major 2023 Hurricane in the East Pacific
After a quiet start, the 2023 eastern Pacific hurricane season recently picked up in activity with the formation of the season’s first major hurricane, Hurricane Calvin. Calvin originated on July 11 from an area of low pressure located about 510 miles (~820 km) south-southwest of Manzanillo, Mexico, which had become organized enough for the National Hurricane Center (NHC) to declare it Tropical Depression 3E (TD 3E) that afternoon. Located over warm sea surface temperatures (SSTs) of around 84 oF (29 oC), thunderstorm activity near the center of TD 3E continued to increase overnight, and during the early morning hours of July 12, the NHC upgraded the depression to Tropical Storm Calvin. Calvin continued to track westward over the open waters of the eastern Pacific well away from land. Warm SSTs and light-to-moderate wind shear formed an environment conducive for intensification, and Calvin continued to strengthen throughout July 12, becoming a hurricane at 5:00am HST (Hawaii Standard Time) on the morning of July 13. Calvin continued to strengthen throughout the day and following night, becoming a Category 2 storm by 5:00pm (HST) on the July 13 and a Category 3 storm by 5:00am HST on July 14, with maximum sustained winds estimated at 120 mph.
Download this video from the NASA Goddard Scientific Visualization Studio
The combination of NASA’s IMERG precipitation product and the GPM Core Observatory satellite with its array of active and passive sensors is ideal for monitoring and studying tropical cyclones, especially over the open ocean where land-based radar data is scarce. The above animation shows Calvin as it tracks through the eastern Pacific roughly halfway between the west coast of Mexico and Hawaii. The first part of the animation shows a time loop of IMERG surface rainfall estimates beginning at 8:20 UTC July 14 (10:20pm HST July 13) overlaid on infrared (IR) cloud top data. The animation begins when Calvin is already a Category 2 hurricane. IMERG shows that Calvin had a well-developed though still somewhat asymmetric precipitation field with heavy rain wrapped completely around a barely discernable eye, along with a large area of heavy rain wrapping around the eastern side of the storm. IMERG shows that over the next 24 hours, Calvin’s eye tended to become more pronounced and the rain field more symmetric as the storm continued to intensify.
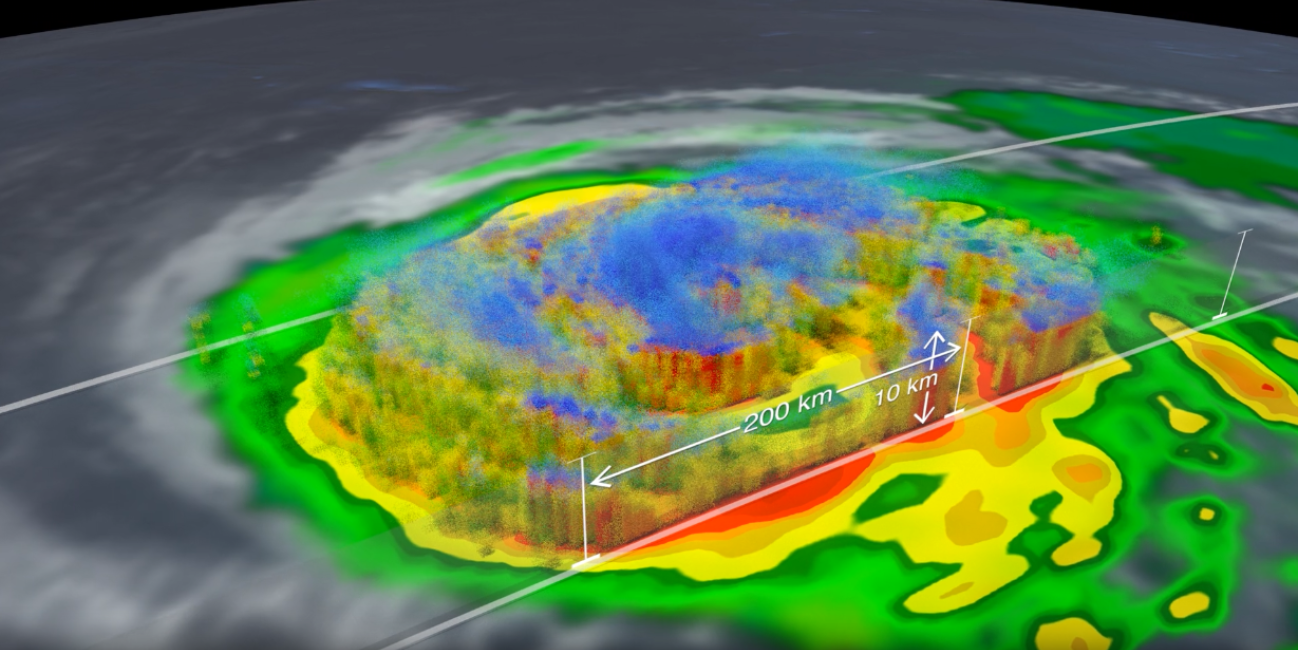
During the night of the July 14 and 15, the GPM Core Observatory flew over the center of Calvin. The second part of the animation shows a detailed look into the structure and intensity of precipitation within Calvin from the GPM Core Observatory around 9:53 UTC July 15 (11:53pm HST July 14). Surface rainfall estimates from the GPM Microwave Imager (GMI) and Dual-frequency Precipitation Radar (DPR) show Calvin is fairly symmetric with heavy rainbands (shown in red) wrapping nearly completely around a fairly well-defined eye at the center. An area of extremely heavy rain (shown in purple) is located in the western part of the eyewall. The DPR actively scanned Calvin to provide a 3D perspective of its precipitation. Areas shaded in blue show frozen precipitation aloft, mainly in the form of snow but also graupel (rimed snow particles) and frozen drops, which are both present in the cores of active thunderstorms. The DPR shows that the tallest, deepest thunderstorms with precipitation tops exceeding 10 km are located in the western part of the eyewall in association with the heaviest rain also west of the center. At the time of the GPM overpass, Calvin had already reached its peak intensity and was starting to weaken a result of passing over cooler SSTs. Maximum sustained winds were reported at 105 mph by NHC.
Calvin continued to weaken over the next couple of days, and as of 8:00am HST July 17, Calvin, now a moderate intensity tropical storm, was located about 850 miles east of Hilo, Hawaii and is expected to pass just south of the Big Island of Hawaii as a weak tropical storm.
Credits:
Visualization by Alex Kekesi (GST / NASA GSFC) and the NASA Goddard Scientific Visualization Studio
Text by Steve Lang (SSAI / NASA GSFC)