
Fiona Becomes a Major Hurricane in the Atlantic
After leaving the Caribbean, Hurricane Fiona became both the strongest and the first major hurricane of the 2022 Atlantic hurricane season as it made its way northward through the western Atlantic. Fiona began as an African easterly wave that moved across the tropical Atlantic in the direction of the Caribbean. While still about 800 miles east of the Leeward Isles, this wave organized into a tropical depression on Sept.14th. Later that same day, the depression strengthened and became Tropical Storm Fiona. Fiona remained a moderate tropical storm as it passed through the Leeward Isles on the evening of the 16th near Guadeloupe with maximum sustained winds reported at 50 mph by the National Hurricane Center (NHC). After entering the northeastern Caribbean, Fiona took a west-northwest track in the direction of Puerto Rico and began to slowly intensify, becoming a Category 1 hurricane at 11am (AST) on the 18th just before making landfall at 3:20pm (AST) near Punta Tocon with maximum sustained winds estimated at 85 mph. After passing over the southwest tip of Puerto Rico, Fiona emerged over the Mona Passage before making landfall in the Dominican Republic early the next morning at 3:30 am AST on the 19th near Boca de Yuma with sustained winds of 90 mph.
After passing over northeast Hispaniola, Fiona took a northwest track as it re-emerged into the Atlantic around midday on the 19th in the direction of the Turks and Caicos Islands. As it moved away from Hispaniola, Fiona was able to overcome some moderate southwesterly wind shear and began to intensify over warm waters, becoming a Category 2 storm later that afternoon. Early on the morning of the 20th at 2am (AST) , Fiona became a major Category 3 hurricane with sustained winds reported at 115 mph as it born down on Grand Turk Island. After passing near Grand Turk Island, Fiona intensified further becoming a Category 4 storm with sustained winds of 130 mph early on the morning of the 21st as it headed due north about 755 miles southwest of Bermuda. Fiona maintained its intensity throughout the day on the 21st as it continued northward over the open western Atlantic well east of the US East Coast. Fiona continued to maintain its intensity on the 22nd as it accelerated northward ahead of a deep upper-level trough of low pressure over the northeastern US, passing west and northwest of Bermuda.
Download this video in high resolution from the NASA Goddard Scientific Visualization Studio
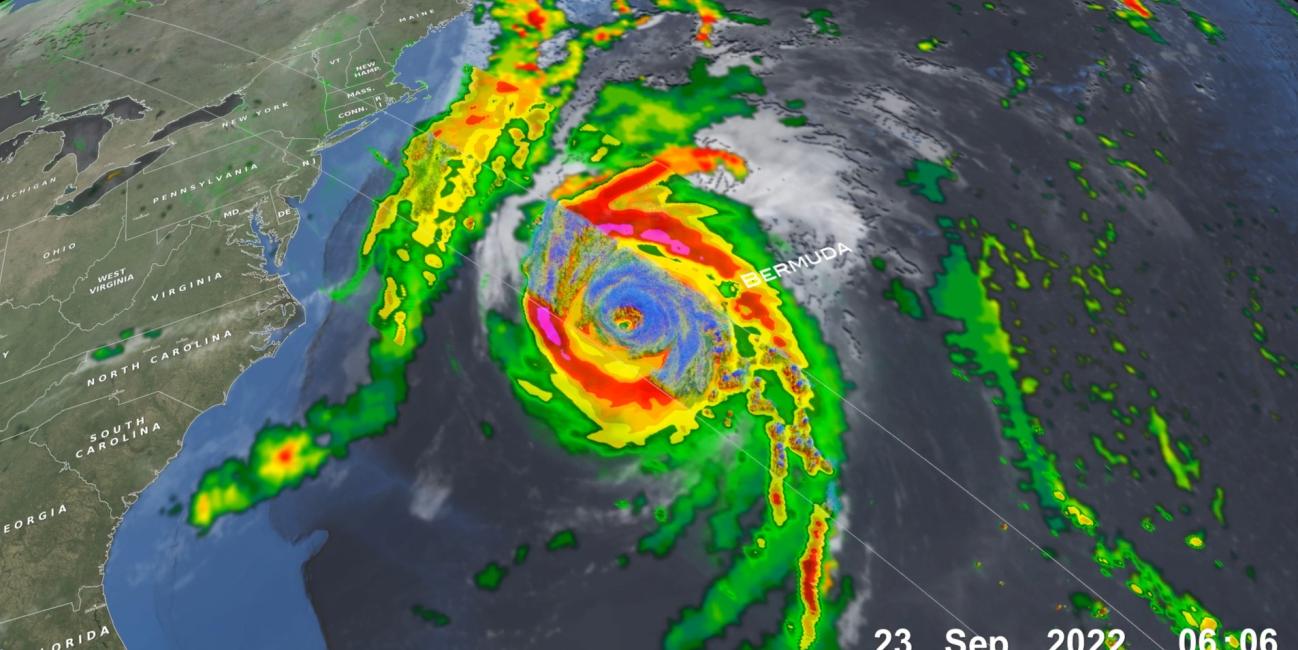
Around this time, at about 05:30 UTC (1:30 AST) on the morning of Sept. 23rd, the GPM Core Observatory satellite passed over the center of Fiona when the center was located about 185 miles due west of Bermuda. Corresponding images of surface rain rates estimated from the GPM Microwave Imager (GMI) and Dual-frequency Precipitation Radar (DPR) (inner swath) show a large, intense outer rainband wrapping nearly completely around the storm well away from the center. This is generally separated by an area of weak rain with another area of more intense rain located closer to the center wrapping around the southern, eastern and western parts of the storm. This type of structure is generally characteristic of a large, intense storm that has passed its peak intensity. Over time, hurricane wind fields tend to expand away from the center. Echo top heights derived from the GPM DPR provide a 3D perspective of the precipitation within Fiona. The brighter red areas show that thunderstorms are still active in the southern and eastern portions of the eyewall and helping to maintain its intensity, which was still reported at 130 mph by NHC. However, soon after these images were taken, Fiona began to weaken due to the effects of increasing vertical wind shear. Fiona was forecast to continue to weaken and transition to a post tropical storm but remained near hurricane intensity as closed in on the Canadian Maritimes.
Credits:
Visualization by Alex Kekesi (GST / NASA GSFC) and the NASA Goddard Scientific Visualization Studio
Text by Steve Lang (SSAI / NASA GSFC)