
Hurricane Francine Makes Landfall in Louisiana
Updated: Wednesday, September 18, 2024
Hurricane Francine made landfall on Wednesday, September 11, at 5:00 p.m. CDT on the southern coast of Louisiana, approximately 30 miles south-southwest of Morgan City. The National Hurricane Center (NHC) classified it as a Category 2 storm, with maximum sustained winds estimated at 100 mph.
Francine originated from a westward-moving tropical wave of low pressure, known as an African easterly wave. This wave, as is typical, emerged off the west coast of Africa before traversing the tropical Atlantic and Caribbean. These waves often serve as seedlings for tropical storms and hurricanes in the Atlantic Basin, including the Caribbean and Gulf of Mexico. The northern part of this wave crossed the Yucatan Peninsula and emerged into the Bay of Campeche in the southwest Gulf of Mexico on Sept. 7. This resulted in increased shower and thundershower activity over the southwest Gulf of Mexico on Sept. 7 and 8 where the wave was near the southern end of a stationary front extending southward from the northern Gulf. However, this area of enhanced shower activity remained broad, espcially in the north-south direction, with no well-defined center. Finally, after additional strong thunderstorm activity, on the morning of Sept. 9, NHC saw sufficient evidence of a low-level circulation and sustained wind speeds to declare the formation of Tropical Storm Francine.
Located over very warm water in the western Gulf of Mexico and in a low wind shear environment, conditions were favorable for rapid strengthening. Initially, Francine did respond to these favorable conditions and strengthened into a strong tropical storm with maximum sustained winds reported at 65 mph by NHC at 4:00 p.m. CDT; however, soon after, Francine ingested a mass of dry air, which choked off convection near the storm’s core and effectively capped further intensification for the remainder of the day. The following morning on Sept. 10, Francine recovered from the dry air, and thunderstorm activity once again increased near the storm’s center, allowing the central pressure to fall and Francine to begin strengthening. At 7:00 p.m. CDT, NHC reported that Francine had become a hurricane, and by 10:20 p.m. CDT, NHC reported that Francine’s maximum sustained winds had increased to 85 mph. It was at this time that the GPM core observatory overflew Francine.
Download video (right-click -> "Save As")
This animation begins with a series of surface rainfall estimates from NASA’s IMERG precipitation product showing Francine’s transition from a tropical storm into a hurricane in the western Gulf of Mexico. The animation begins at 3:41 UTC Sept. 10 (10:41 p.m. CDT Sept. 9). Initially, IMERG shows two areas of rain containing moderate to heavy rain (orange and red areas) separated by a zone of weak to no rain. This zone reflects the dry air that Francine ingested earlier in the day that wrapped around the eastern side of the storm’s circulation, which is centered in the southwestern most rain mass. As the animation progresses, IMERG shows the emergence of heavier rain in association with increased thunderstorm activity followed by the emergence of an eye as Francine strengthens into a hurricane.
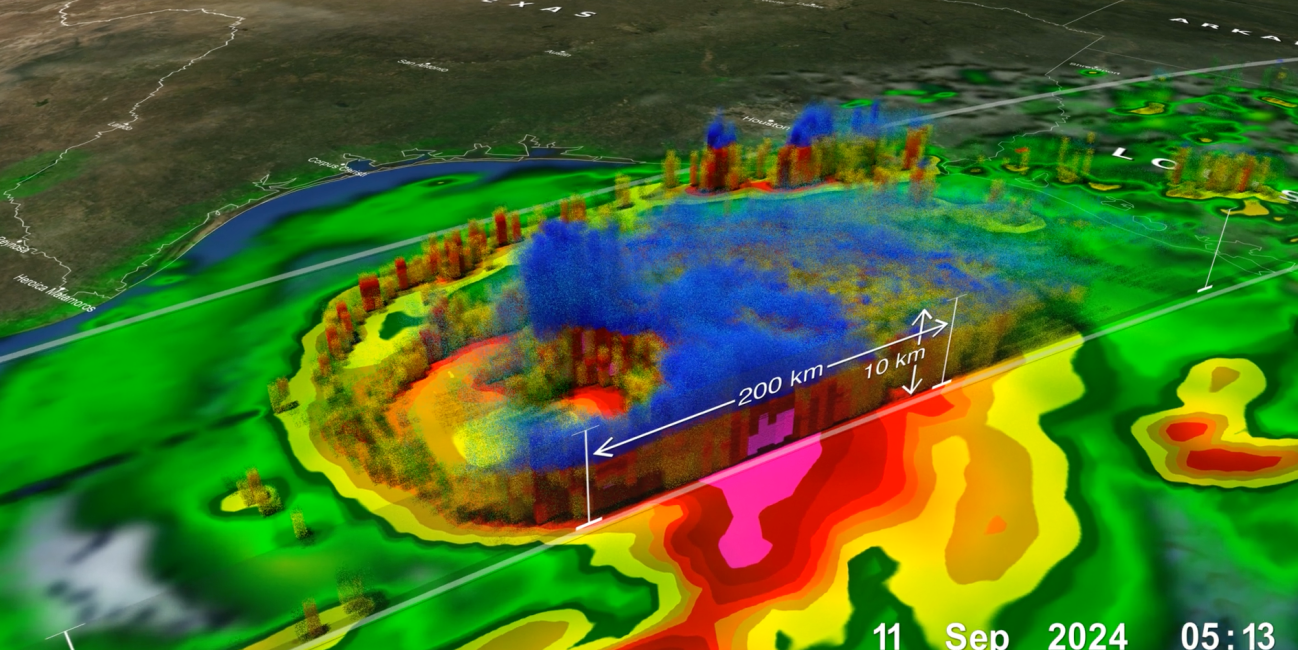
The second part of the animation provides a detailed look at the structure and intensity of precipitation within Francine from the GPM Core Observatory when it overflew the storm around 4:41 UTC Sept. 11 (11:41 p.m. CDT Sept. 10) when Francine’s center was about 295 miles southwest of Morgan City, LA. Surface rainfall estimates from the GPM Microwave Imager (GMI) show heavy (red areas) to intense (magenta) rain wrapping around the storm’s center on its northern and northeastern sides. GPM’s Dual-frequency Precipitation Radar (DPR) scanned the center of Francine to provide a 3D perspective of its precipitation structure. Areas shaded in blue show frozen precipitation aloft, and their height indicates thunderstorm intensity within the storm in addition to the surface rain intensity. The DPR shows several very deep towers extending above 10 km, especially in the northern portion of Francine’s eyewall that are associated with the areas of intense surface rain. These intense thunderstorms are releasing large amounts of heat into the storm and are responsible for maintaining and intensifying its circulation. The DPR also shows a lack of deeper convection on the southwestern side of the storm due to the effects of southwesterly wind shear in association with an upper-level trough located over Texas. This same trough also helped steer the storm northeastward.
As the animation continues, Francine is seen moving northeast towards the Louisiana coast beginning at 5:13 UTC (12:13 a.m. CDT) Sept 11, until the GPM Core Observatory once again overflew Francine at 14:32 UTC (9:32 a.m. CDT) that same day. Although the eye is a little more apparent, similar to the previous overpass, GPM shows Francine has the same basic asymmetric structure. On the one hand, deep convective towers, fueled by the warm waters of the Gulf, continue to produce areas of intense rain in the northern part of the eyewall. However, the southwest part of the storm continues to show the inhibiting effects of southwesterly wind shear and remains devoid of thunderstorm activity with a much more constricted precipitation shield. At the time of this 2nd overpass, NHC reported Francine’s maximum sustained winds at 90 mph, a strong Category 1 storm.
The animation then continues once again, showing Francine reaching its peak intensity of Category 2 at 4:00 p.m. CDT before making landfall along the southern coast of Louisiana about 85 miles west-southwest of New Orleans and continuing into northern Mississippi. It was at this time that the GPM Core Observatory yet again overflew Francine at 13:10 UTC (8:10 a.m. CDT) Sept. 12, when the center was just south of Jackson, MS. GPM again shows most of the rain, including nearly all of the heavy rain (shown in red), located within the front side of the storm, north and northwest of the center. The DPR shows thunderstorm activity continuing within what remains of the northern eyewall, but the intensity is greatly diminished compared to when Francine was out over the warm waters of the Gulf. At the time of this last overpass, Francine had been downgraded to a tropical depression with NHC reporting maximum sustained winds of 35 mph. Francine caused down trees, power outages and localized flooding in parts of Texas, Louisiana, Mississippi, and Alabama, but there were no reported fatalities due to the storm.
Credits:
Visualization by Alex Kekesi (NASA GSFC / GST) and the NASA Goddard Scientific Visualization Studio using GPM data.
Text by Steve Lang (SSAI / NASA GSFC)