
Hurricane Fiona's Caribbean and Canadian Landfalls
In September 2022, Hurricane Fiona had impacts in the Caribbean, on Bermuda, and in Canada. NASA's satellites and science algorithms helped to monitor this hurricane in near real time. The following animation shows the hurricane's entire track from Sept. 14 through 24. Two specific phases of the storm are described in subsequent sections of this post.
Download Video (right-click -> "Save As")
Canadian Impacts
At approximately 4 AM local time (Atlantic Daylight Time) on Saturday, Sept. 24, Hurricane Fiona made landfall in Canada with a surface pressure of only 931 hPa at its center according to the National Hurricane Center (NHC). By 6 AM that morning, the NASA IMERG algorithm estimated that Hurricane Fiona had dropped in excess of 6 inches of rainfall off the coast of Nova Scotia. Rain was still accumulating over Atlantic Canada at that time. The image below shows these IMERG rainfall estimates and the NHC estimate of the distance that tropical-storm strength winds (39 mph, 34 knots) extend from the hurricane's center.
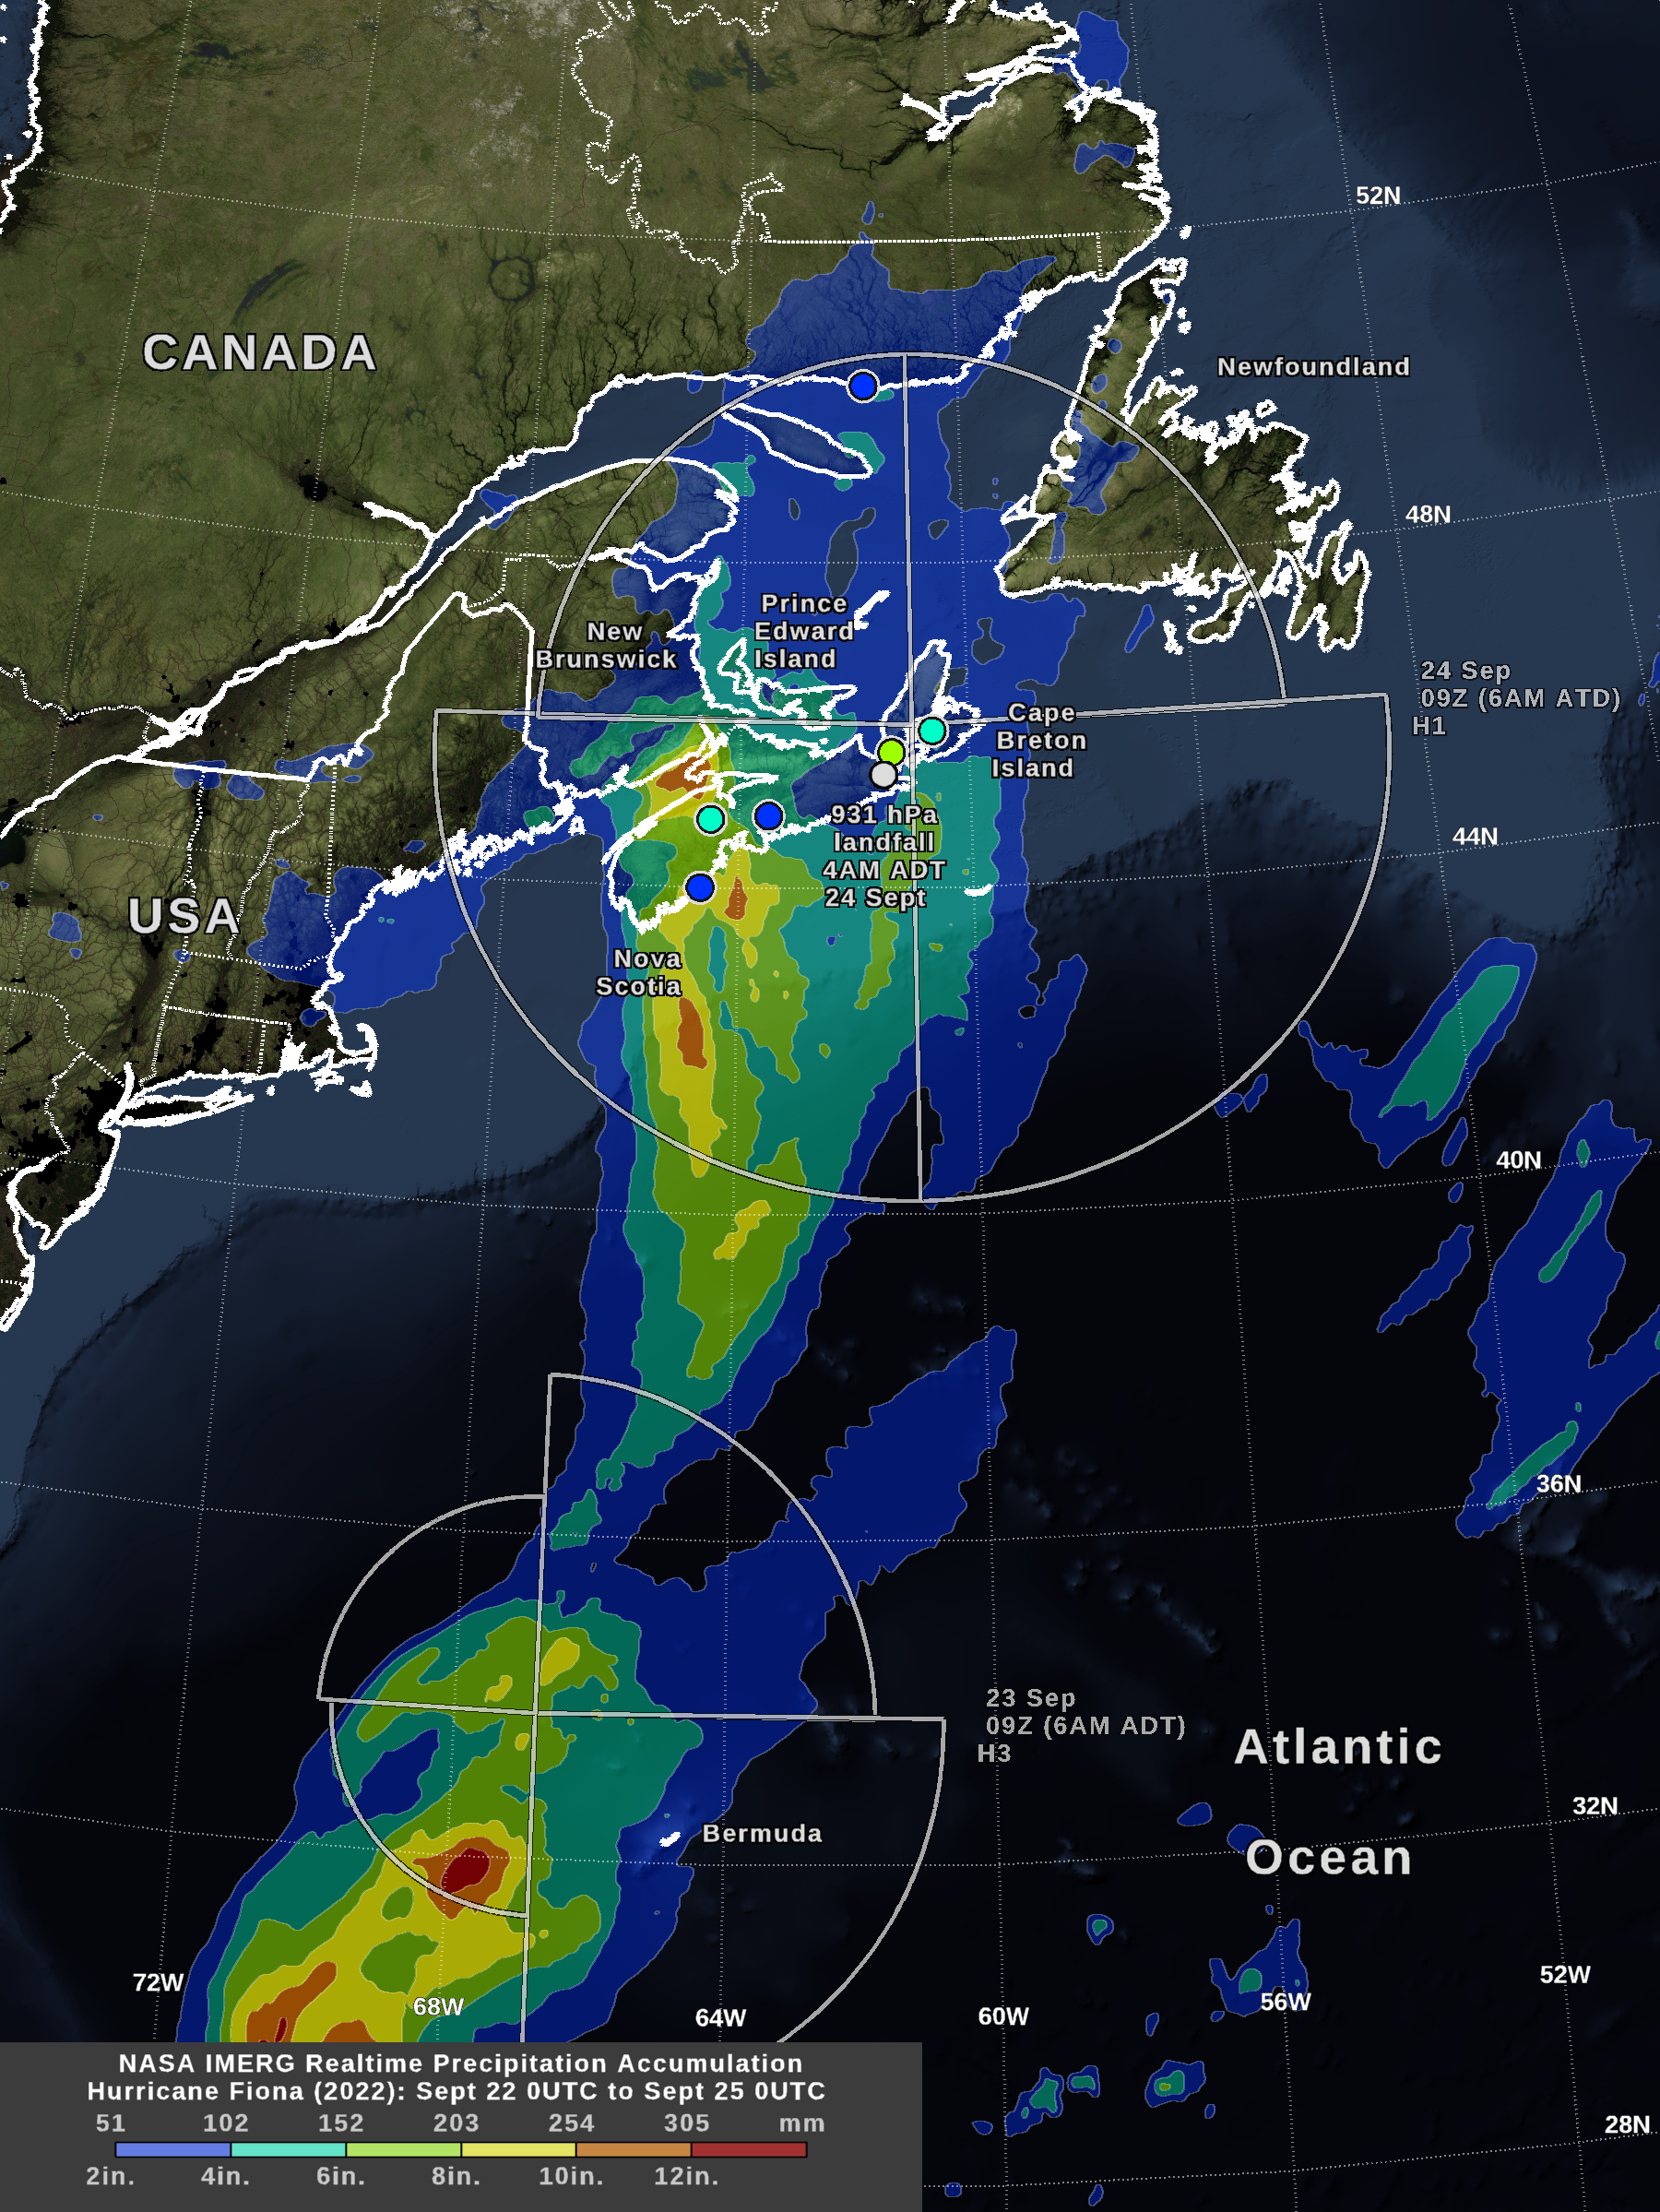
Fiona's 3-day rainfall accumulations in Canada were generally in the 2-to-8-inch range, according to rain-gauge data provided by the Canadian government: historical data. Selected gauges are shown in the image using circles that are color-coded with the same color table as the IMERG data. The IMERG-estimated 3-day accumulation over Nova Scotia is, for the most part, in the same 2-to-8-inch range as the rain-gauge data.
On September 23, which was one day before the Canadian landfall, IMERG estimated higher rainfall totals of over 12 inches when Hurricane Fiona passed near Bermuda. The storm was moving forward more slowly at that time, which increased rainfall totals. Rainfall totals were even higher when Hurricane Fiona passed through the Caribbean, as described in the section below.
September 23, a north-south-oriented cold front moved east off the shore of New England and the US Mid-Atlantic region. Rain and thunderstorms associated with that cold front are seen in the IMERG rainfall image, specifically along the coast of Maine and Massachusetts. The blue contour indicates 2-to-4-inch accumulation from the cold front along the Maine coast.
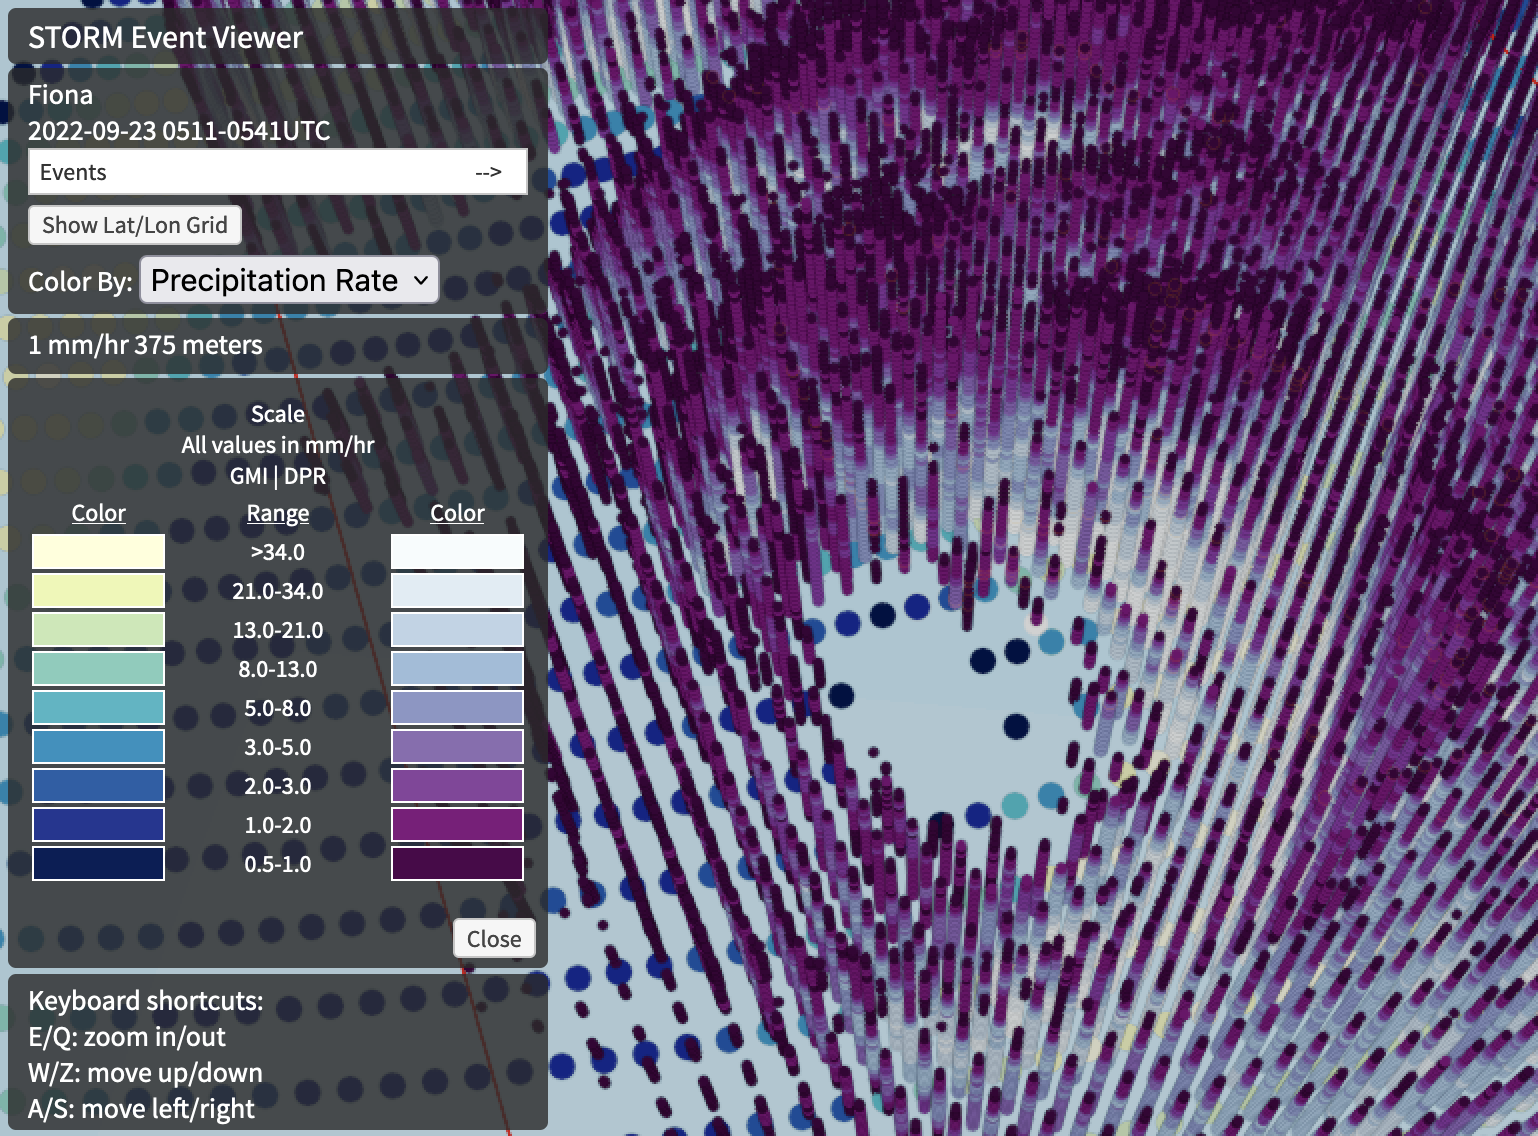
NASA Global Precipitation Measurement (GPM) satellite carries a Japanese-built weather radar capable of estimating the three-dimensional structure of storm systems. On September 23, this radar (the Dual-frequency Precipitation Radar, DPR) observed the structure of Hurricane Fiona's eyewall. An interactive, 3D visualization of that overflight is provided by the Precipitation Processing System's Event Viewer. A screen capture from the Event Viewer is shown below. To launch the viewer in a web browser visit this URL: https://gpm.nasa.gov/storm-viewer/EventViewer.html.
Caribbean Impacts
Between Sept. 16 and 19, 2022, Hurricane Fiona struck Guadeloupe, Puerto Rico, and the Dominican Republic. NASA estimated precipitation in the region in near real-time using data from an international constellation of satellites processed by the IMERG algorithm.
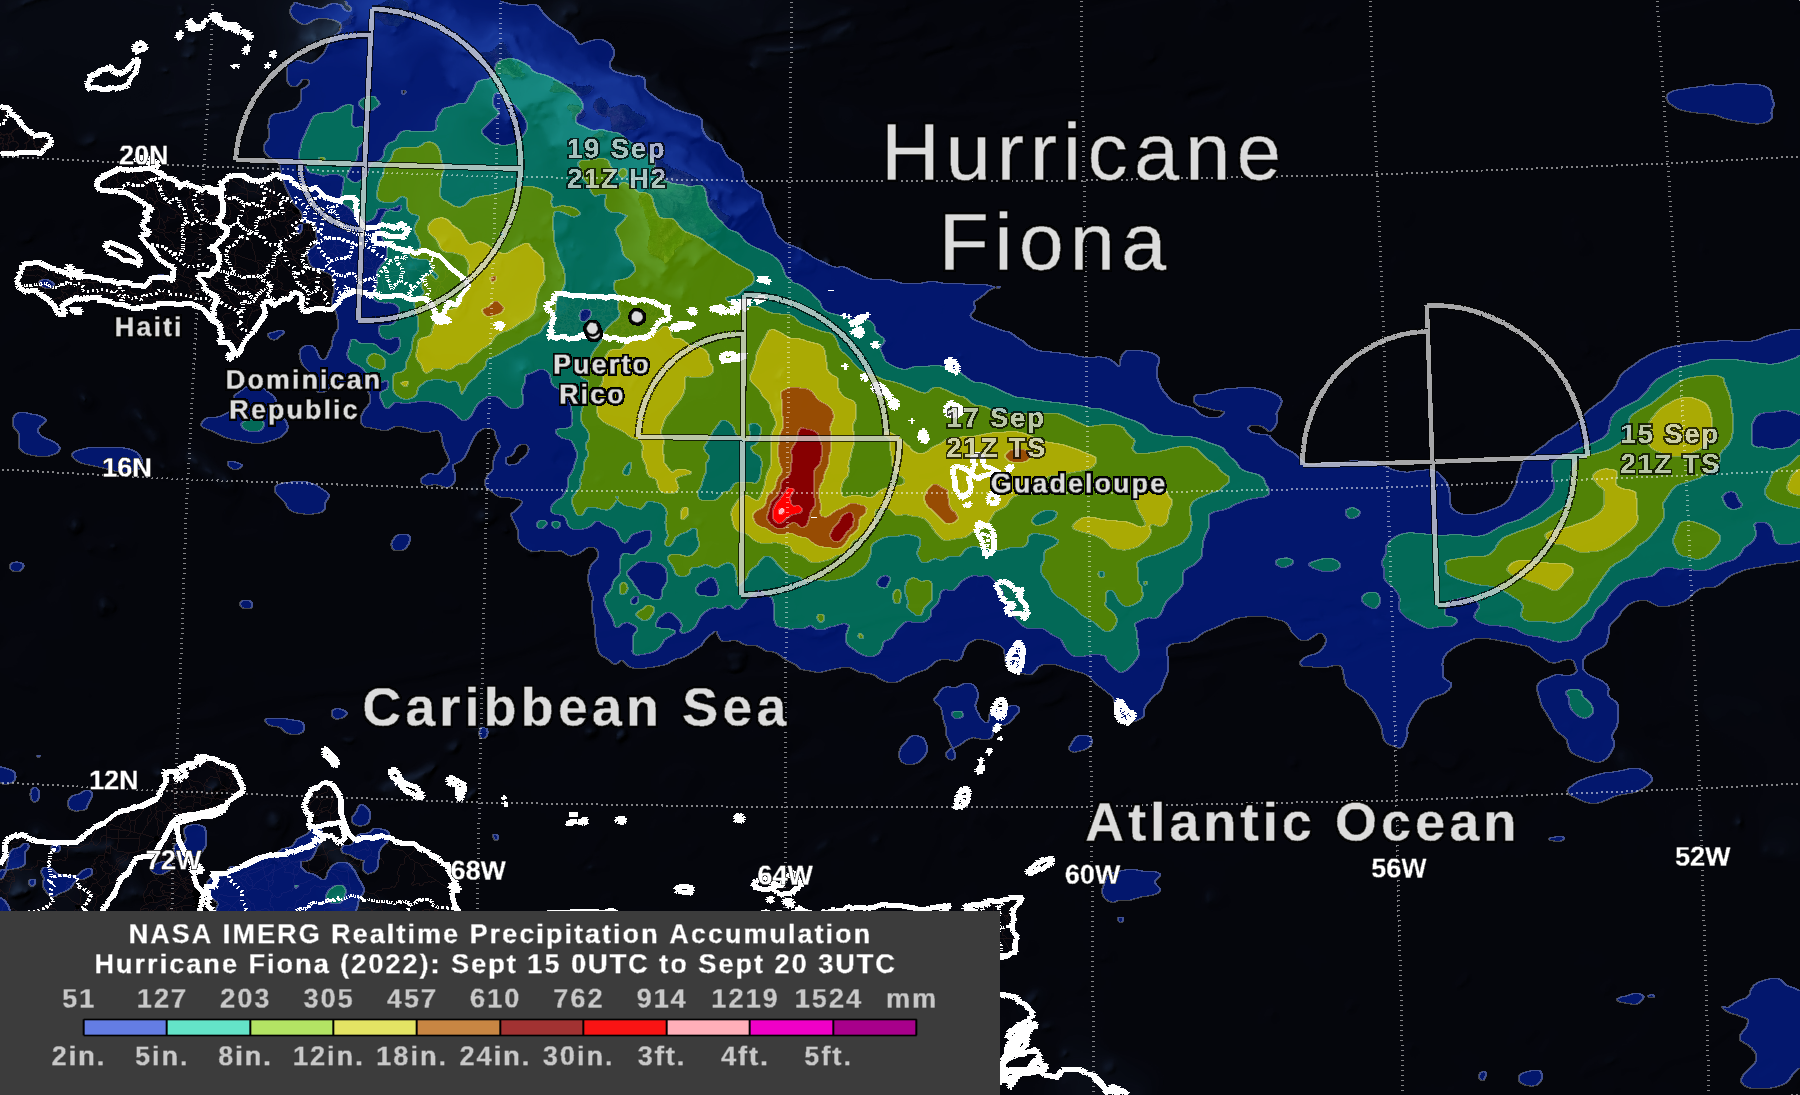
IMERG precipitation estimates from Hurricane Fiona from Sept. 15 to 20, 2022. Credits: NASA
IMERG estimated that Fiona dropped 12 to 18 inches of rainfall over Guadeloupe and over the ocean just south of Puerto Rico. Media sources and the National Weather Service reported that heavy rainfall accumulation extended somewhat further north, exceeding 20 inches over part of southeastern and central Puerto Rico. Some locations with particularly high accumulation from the storm are indicated with white dots in the image.
IMERG's strength is its global reach, including regions of land and ocean where ground-based weather radar data is unavailable. Where ground radar or rain gauges are present, they may do better at capturing small, intense rain cells and the local effects of mountainous terrain. These strengths and limitations are illustrated by IMERG's ability to depict Fiona's full swath of rain across the Atlantic and its underestimation in Puerto Rico.
The National Hurricane Center reported that tropical-storm strength winds extended out from the center of the storm at the distances indicated in the three wind figures shown in the image. At the first two times shown (September 15 and 17), Fiona was a tropical storm with maximum sustained surface winds 39-73 mph. By September 19, Fiona had strengthened to a category-2 hurricane (96-110 mph winds).
Download Video (right-click -> "Save As")
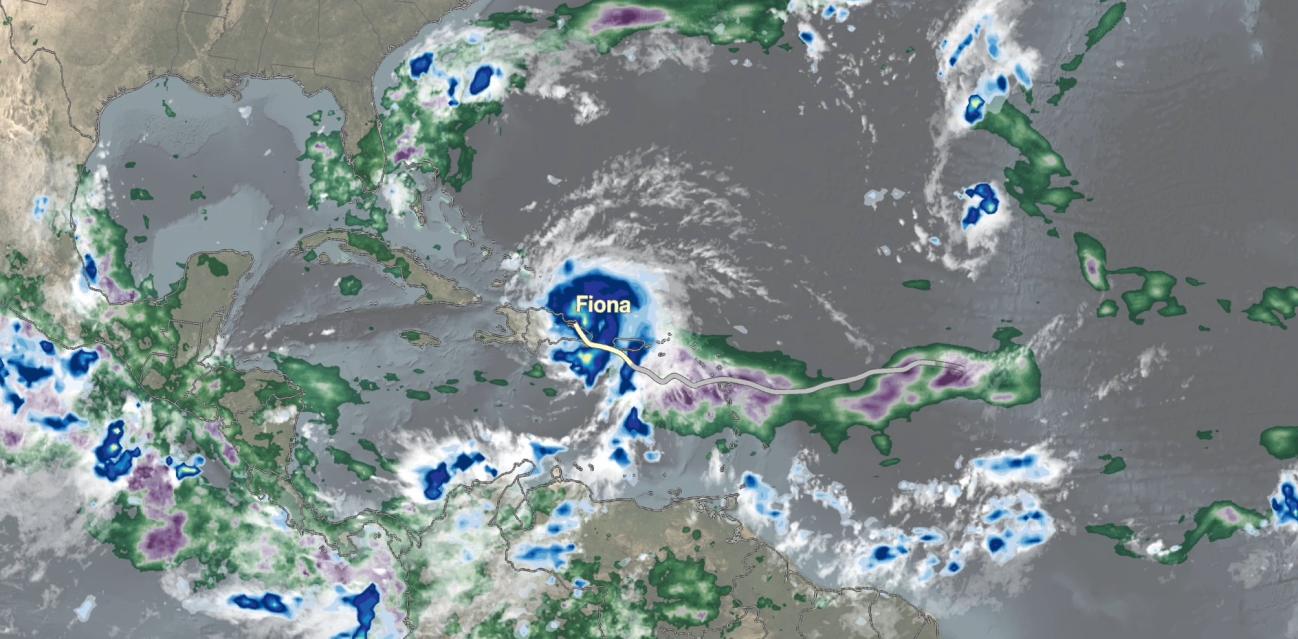
This animation shows surface precipitation estimates from IMERG along Hurricane Fiona’s track from Sept. 14 through the early morning of Sept. 20, 2022. IMERG rain rates are shown in blue/yellow shading, which is overlaid on cloud data (shown in white/gray) based on geosynchronous satellite infrared observations. Below the rain rates and cloud data, IMERG rainfall accumulations are shown in green and purple. By the morning of September 20, Fiona had intensified to a Category-3 storm and was forecast to move northward toward Bermuda by the end of the week.
See more NASA imagery from Hurricane Fiona at NASA Earth Observatory
Credits: NASA Goddard Space Flight Center. Visualization and caption by Jason West and Owen Kelley (NASA/PPS). Updated 26 Sept 2022 10AM EDT: