
Powerful Hurricane Idalia Makes Landfall in Florida’s Big Bend
After threatening much of Florida’s western coast, Hurricane Idalia made landfall Wednesday morning in the Big Bend region of Florida’s northwest coast near Keaton Beach at 7:45 a.m. EDT, Aug. 30, as a strong Category 3 storm with sustained winds reported at 125 mph by the National Hurricane Center.
Idalia’s formation was somewhat unusual. Typically, when entering the heart of the hurricane season tropical storms and hurricanes form and expand eastward across the tropical Atlantic region towards Africa’s coast. However, storms occasionally still form in the western Caribbean, as was the case with Idalia, which became a tropical depression (TD #10) on the afternoon of Aug. 26, about 65 miles (~105 km) northeast of Cozumel, Mexico, near the Yucatan Channel. The broad area of low pressure leading to TD #10, first began in the far Eastern Pacific within the Intertropical Convergence Zone, where water temperatures are running above normal due to the ongoing El Niño, before drifting northward across Central America and into the far western Caribbean. After becoming a tropical depression on Aug. 26, the soon-to-be-named Idalia spent the next day and a half making a loop in the far northwest corner of the Caribbean, during which time it became a strong tropical storm. On the morning of Aug. 28 Idalia settled into a northerly track, drawn northward by a trough of low pressure over the central Gulf of Mexico and strengthening high pressure to the east. Around 10:00 p.m. CDT, Idalia passed near the western tip of Cuba as a strong tropical storm and into the southeastern Gulf of Mexico.
Download this video from the NASA Goddard Scientific Visualization Studio
The above animation shows Idalia as it made its way through the eastern Gulf of Mexico. The animation begins with a 24-hour time loop of surface rainfall estimates from NASA’s IMERG precipitation product starting at 11:11 pm EDT on Aug. 28 (03:11 UTC Aug. 29) just as Idalia was passing the western tip of Cuba and into the Gulf of Mexico. IMERG shows that initially Idalia’s rain field was very asymmetric with most of the heavy rain (in red) located south and east of the center. However, IMERG also shows heavy rain consolidating around the center as the storm moved further into the Gulf as well as fairly persistent bands of moderate (in orange) to heavy rain moving over Florida on the eastern side of the storm. Over the course of the IMERG animation, Idalia strengthened from a strong tropical storm to a Category 2 hurricane at 5:00 pm EDT (21:00 UTC).
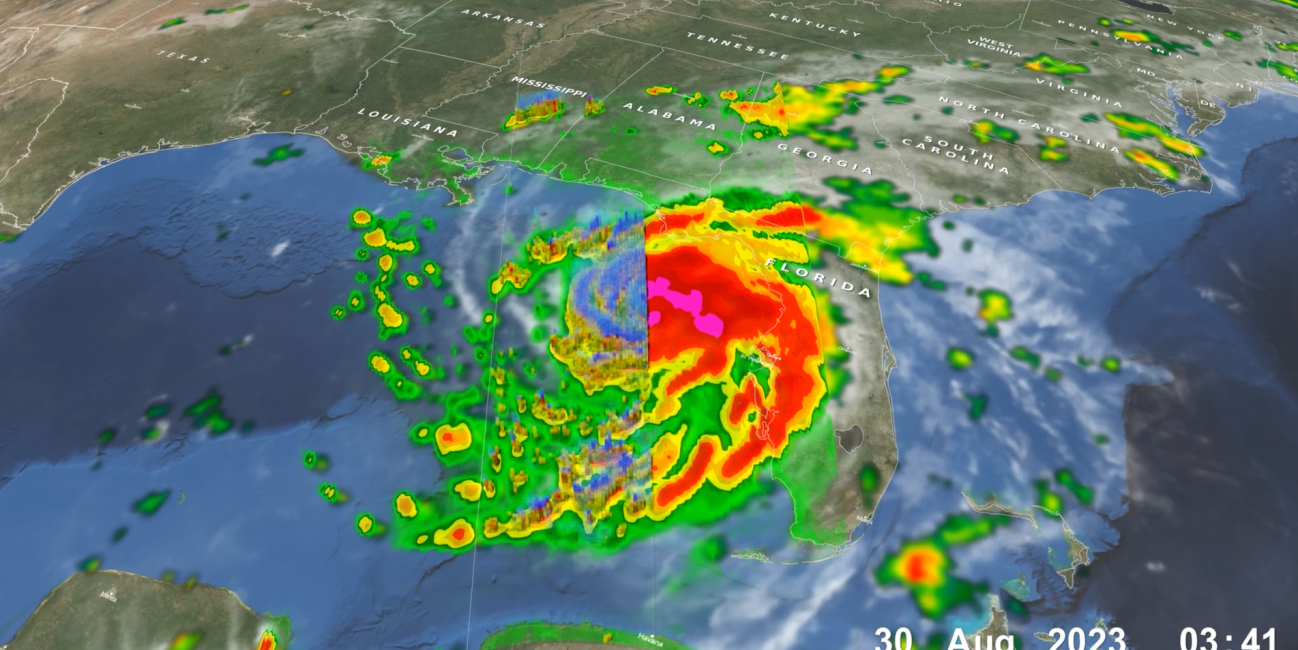
The second part of the animation shows a detailed look into the structure and intensity of Idalia’s precipitation, as observed by the NASA / JAXA GPM Core Observatory satellite when it flew over the storm around 11:41 pm EDT on Aug. 29 (03:41 UTC Aug. 30) when the center of Idalia was about 125 miles due west of Tampa, FL. Surface rainfall estimates from the GPM Microwave Imager show heavy rain (in red) all around the center of the storm, with areas of intense rain (shown in magenta) near the center and around the eastern side of the center. Heavy rainbands also extend over most of western peninsular Florida and into the central panhandle region.
GPM’s Dual-frequency Precipitation Radar scanned the southwest half of the storm to provide a 3D perspective of its precipitation. Areas shaded in blue show frozen precipitation high in the atmosphere. The height of this precipitation indicates intense thunderstorms within the hurricane in addition to the surface rain intensity. The DPR shows several deep convective towers both in the outer rainbands and in the southwest part of the eyewall, which are associated with the areas of intense rain. Other deep towers are likely present east of the center where there are areas of intense surface rain, but they are not visible in this animation due to being outside of the DPR’s swath.
At the time of the GPM overpass Idalia was a strong Category 2 hurricane with sustained winds of 110 mph. Idalia would go on to further intensify, briefly becoming a Category 4 storm with sustained winds of 145 mph before weakening prior to making landfall. Idalia then made its way rapidly across southeastern Georgia and into the coastal Carolinas as it weakened into a tropical storm. As of Thursday morning, more than 300,000 customers in Florida, Georgia and South Carolina were without power according to media reports.
Download this video (right-click -> "Save As")
This animation shows IMERG estimated rain rates (blue and yellow shading) and accumulations (green and purple shading) from Aug. 20, 8:00 p.m. EDT (00:00 UTC) through Aug. 31 3:30 a.m. ET (07:30 UTC) alongside the storm tracks of Hurricanes Idalia and Franklin. National Hurricane Center storm track and intensity estimates are shown by the multi-colored lines, and cloudiness is shown in white and gray shading from geosynchronous satellite infrared sensor estimates.
By the end of the animation, Idalia had crossed the Big Bend region of Florida as well as southeastern Georgia and South Carolina before emerging into the Atlantic Ocean as a tropical storm. IMERG estimated rainfall from Idalia to be over 2 inches (green shading) across large parts of the U.S. Southeast, with totals in some areas of Georgia and the Carolinas estimated at higher than 6 inches (light purple shading). These totals were broadly consistent with local rain gauge measurements by the National Weather Service. IMERG is a uniquely valuable data product for tracking extreme weather events like hurricanes, as it allows precipitation to be estimated over oceans as well as land across the storm’s entire track.
Credits:
First visualization by Alex Kekesi (GST / NASA GSFC) and the NASA Goddard Scientific Visualization Studio
Second visualization by Jason West (NASA GSFC, PPS, KBR)
Text by Steve Lang (SSAI / NASA GSFC) and Jacob Reed (Telophase / NASA GSFC)