
Texas Hill Country Hit by Powerful Floods
Over the fourth of July weekend, the Texas Hill Country was devastated by a powerful flash flood event. River levels rose rapidly, on the order of 20 feet or more in 1 to 2 hours or less, all along the upper part of the Guadalupe River. The main flood event started overnight and continued throughout the morning of July 4, resulting in widespread destruction, hundreds of water rescues, many deaths, and numerous people still reported as missing.
The Hill Country can be susceptible to flash floods as water tends to run off rather than being absorbed by the soil and plants. The culprit for this particular event was a slow-moving, organized cluster of thunderstorms, known as a mesoscale convective system or MCS. This MCS was organized in part by the remnants of Tropical Storm Barry, which made landfall days earlier near Tampico, Mexico on the evening of June 29 as a tropical depression. As Barry’s remnants, in the form of a mesoscale convective vortex or MCV, moved north into southwest Texas and on into the Hill Country, they merged with ongoing storms in the region. MCV’s can be long-lived and can help to enhance and focus thunderstorm activity. The resulting thunderstorm complex was further enhanced by abundant low-level moisture streaming up from the south around the western side of an area of high pressure over the Gulf as well as upper-level moisture coming in from the East Pacific. The result was heavy rain across much of central and west Texas as the MCS drifted slowly eastward.
Download video (right-click -> "Save As")
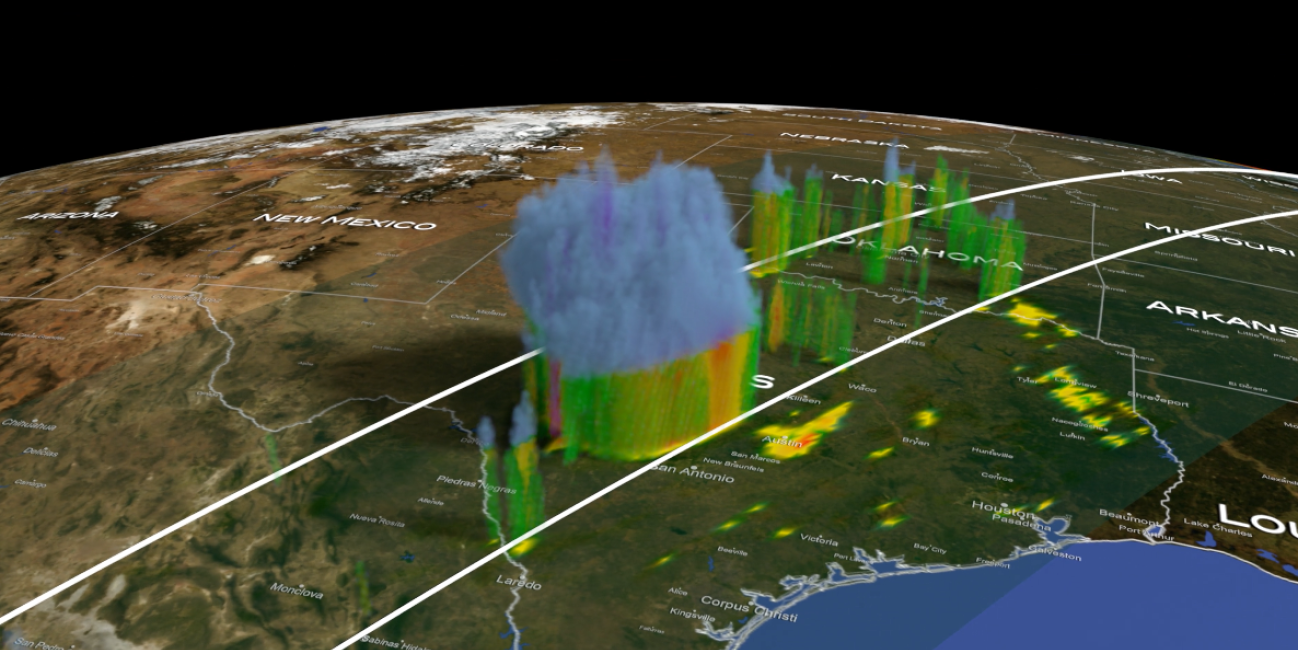
The above animation provides a detailed look into the structure and intensity of the precipitation within the MCS when the GPM Core Observatory overflew the storm complex around 11:00 a.m. CDT (16:00 UTC) on July 4. Surface rainfall estimates from the GPM Microwave Imager (GMI) show a large, coherent, circular area of heavy (red areas) to intense (magenta) rain over the Texas Hill Country. GPM’s Dual-frequency Precipitation Radar (DPR) can also provide a 3D perspective of the precipitation within the MCS. Areas shaded in blue denote frozen precipitation high in the atmosphere and reveal several deep convective towers with strong updrafts within the MCS. Associated with these are columns of intense rain (magenta). Even areas with less deep towers show heavy (red) to intense rain and reflect the abundant moisture and efficient rainfall production within the system.
Credits:
Visualization by Alex Kekesi (NASA GSFC / GST) and the NASA Goddard Scientific Visualization Studio using GPM data.
Story by Steve Lang (NASA GSFC / SSAI)