
Rainfall that Matters: A Convective System over Arizona within the North American Monsoon
There is a monsoon that occurs in the southwestern U.S. each summer, and it brought heavy rain to the deserts of Arizona this week. This monsoon is less well known than India's Summer Monsoon, but both monsoons have similar causes [1, 2, 3].
In western Mexico and the southern edge of the southwest U.S., most of the year's rain typically falls in just three months: June, July, and August. The region is shown in light blue in the below climate map, which shows where summer rainfall predominates (Figure 1). This seasonal pattern is known as the North American Monsoon. The map was generated using the long-term record of NASA's IMERG multi-satellite precipitation analysis. Climatologists and forecasters have used various dates to define the exact start and stop dates of the North American Monsoon [4].
Figure 1. Geographic extent of the North American Monsoon

This year's monsoon season has officially begun, and the week of July 12-16 has been an active monsoon week for Southern Arizona [5].
On the morning of July 15, 2021, the National Weather Service issued a warning for severe thunderstorms over Arizona's southern desert with rain rates of 1 inch per hour over ground that was already saturated by recent storms [6]. Under these circumstances, flash flooding is a concern. The location of this warning is indicated by the red circle on the climate map (31.72N latitude and 112.13W longitude in Figure 1).
The NASA / JAXA GPM Core Observatory satellite captured a 3D view of a convective storm system at this location at 8:37 a.m. local time on July 15. The data was collected by the satellite's Dual-frequency Precipitation Radar (DPR). The 3D view is shown in Figure 2. This overflight of the storm system showed several convective cells embedded within it with precipitation rates at the Earth's surface in excess of 1.4 inches per hour. The strongest of these cells contained updrafts that were sufficiently strong to lift ice precipitation overshooting through the top of the troposphere. The troposphere is the lowest layer of the atmosphere that normally contains the weather.
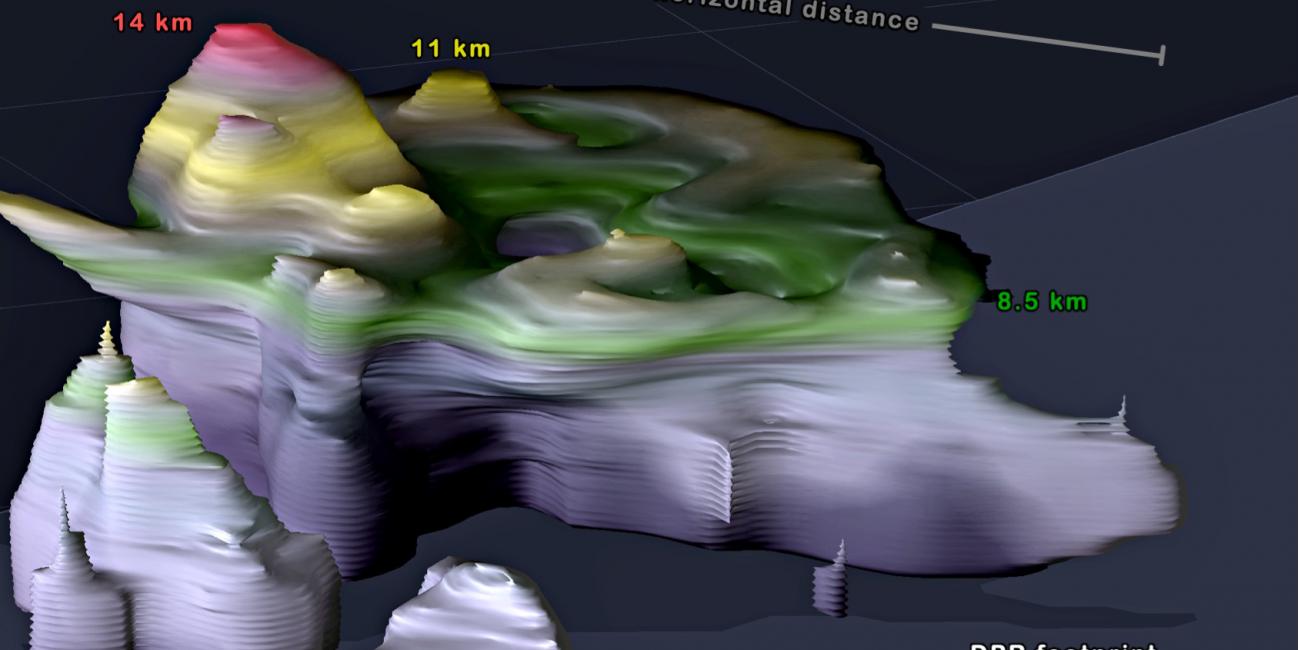
Figure 2. 3D observation of a convective system over Arizona contributing to the North American Monsoon

Shown in red in Figure 2, the Dual-frequency Precipitation Radar detected a 20-dBZ radar-reflectivity signal at an altitude 14 kilometers above the Earth's surface and over 14.8 km above sea level. In Figure 2, the yellow and green areas identify where 20-dBZ radar reflectivity was detected at 11 and 8.5 km altitude, respectively. Commercial airlines cruise at 9 to 13 kilometers. At lower altitudes, this convective cell contained radar reflectivity in excess of 50 dBZ, suggesting hail was present.
This GPM satellite overflight of the storm system occurred at 8:37 a.m., approximately half an hour before the National Weather Service issued its thunderstorm discussion for the area [6].
This portion of Arizona receives only 10 to 15 inches of precipitation in an entire year, on average, according to the long-term record from NASA's IMERG multi-satellite precipitation algorithm. Local accumulation exceeded 2 inches in places due to the convective storm system that passed through this area on July 15, 2021. This storm total was estimated both by the near real-time IMERG algorithm and also by the National Weather Service's preliminary analysis of ground-radar data [https://water.weather.gov].
It is typical of this area's climate that heavy rainfall from convective systems such as this one contribute much of the area's annual rainfall accumulation. According to the IMERG record, this portion of Arizona receives approximately 42% to 50% of its annual accumulation in June through August. Visualization and caption by Owen Kelley (NASA/GMU).
References:
[1] NASA, 2017: NASA Looks at the North American Monsoon. 1:26 minute video featuring NASA Scientist Dr. George Huffman,
https://gpm.nasa.gov/resources/videos/nasa-looks-north-american-monsoon.
[2] Branon, M., 2021 June 17: How the Weather Service cleared the air about Southwest monsoon season. Capital Weather Gang, Washington Post,
https://www.washingtonpost.com/weather/2021/06/17/southwest-monsoon-sea….
[3] Adams, D. K., and A. C. Comrie, 1997: The North American Monsoon. Bulletin of the American Meteorological Society, 78, 2197-2213.
[4] June 15 is currently the National Weather Service's official start date for the North American Monsoon. Adams and Comrie (1997) propose June-August or July-September as possible date ranges for the monsoon.
[5] Arizona Daily Star, 2021 July 14: Tucson passes 2020 monsoon rainfall total; flash flood warning in effect,
https://tucson.com/news/local/tucson-passes-2020-monsoon-rainfall-total….
[6] NWS, 2021 July 15: Mesoscale Precipitation Discussion #0546 issued at 9:10AM EDT on Thursday, July 15, 2021. Weather Prediction Center (WPC), College Park, MD,
https://www.wpc.ncep.noaa.gov/metwatch/metwatch_mpd_multi.php?md=0546&y….