



Super Typhoon Bavi Strikes the Northern Marianas, Brings Heavy Rain to China
After rapidly intensifying over the western Pacific, Super Typhoon Bavi became the second super typhoon to strike the Northern Marianas this year, passing over the island chain north of Guam with maximum sustained winds reported at 180 mph by the US Joint Typhoon Warning Center (JTWC). Super Typhoon Sinlaku also hit the islands back in mid-April. Bavi continued on to make landfall in eastern China where it brought heavy rains to the region.
Like Typhoon Sinlaku, Bavi began in the West Pacific Ocean between Micronesia and the Marshall Islands from a broad westward-moving area of thunderstorm activity. And, like Sinlaku, Bavi’s formation was aided by the presence of the Madden-Julian Oscillation or MJO. The MJO is a large-scale tropical feature that enhances convective activity and propagates eastward in the vicinity of the Equator. It can produce anomalous westerly winds near the Equator, which when combined with easterly trade winds further poleward, can create cyclonic gyres that are favorable for tropical cyclone formation.
After this area of disturbed weather further consolidated, JTWC declared the formation of a tropical depression with maximum sustained winds estimated at 30 mph at 00:00 UTC (10:00 am Guam LST) on July 1. At this time, the center was located northeast of Micronesia about 300 miles west of Kwajalein Atoll. Warm waters of 29 to 30oC (~82 to 86oF) and low wind shear provided a favorable environment for development and over the next day and a half, the system slowly strengthened, becoming a minimal tropical storm by 12:00 UTC and a moderate tropical storm with sustained winds of 60 mph by 00:00 UTC on the 2nd. A high-pressure ridge to the north continued to steer Tropical Storm Bavi west-northwest in the direction of the Northern Marianas.
Beginning around 12:00 UTC on July 2, Bavi underwent a period of rapid intensification with maximum sustained winds increasing from 60 mph to 160 mph by 18 UTC on the 3rd, taking Bavi from a tropical storm to a super typhoon in just over a day’s time. Bavi reached its first peak intensity of 165 mph at 6:00 UTC (4:00 pm Guam LST) on July 4. Now located about 400 miles east-southeast of Guam and moving west-northwest, Bavi weakened slightly due to an eyewall replacement cycle according to JTWC with maximum sustained winds dropping to 155 mph 9 hours later. However, July 5th saw Bavi re-intensify with maximum sustained winds reaching their overall peak intensity of 180 mph at 12:00 UTC (10:00 pm Guam LST) with the center now located just 115 miles east-southeast of Rota.
Super Typhoon Bavi maintained its intensity and struck the island of Rota with the center passing right along the northern coast of the island beginning around 9:00 am LST on July 6 (22:00 UTC 5 July) with maximum sustained winds still reported at 180 mph by JTWC. Wind gusts of 111 mph were reported at Saipan International Airport located about 70 miles to the north-northeast. Widespread damage was reported on Rota while 15.68 inches of rain were reported at Guam International Airport from July 4-5.
After passing the Northern Marianas, Bavi weakened as it underwent another eyewall replacement cycle with sustained winds dropping to 145 mph by 00:00 UTC on the 7th as the storm moved out into the Philippine Sea. But Bavi once again re-intensified into a super typhoon though not as powerful as before with sustained winds reaching 155 mph at 00:00 UTC on July 8. Soon after this time, Bavi began reaching the western edge of the subtropical ridge to north, which caused the storm to recurve towards the northwest. Increasing wind shear and a third eyewall replacement cycle on July 9 saw Bavi weaken substantially with peak sustained winds decreasing steadily to 125 mph by 00:00 UTC on July 9 and just 85 mph by 00:00 UTC on the July 10. By now Bavi was moving steadily to the northwest into the northwestern Philippine Sea about 420 miles east-southeast of the southern tip of Taiwan.
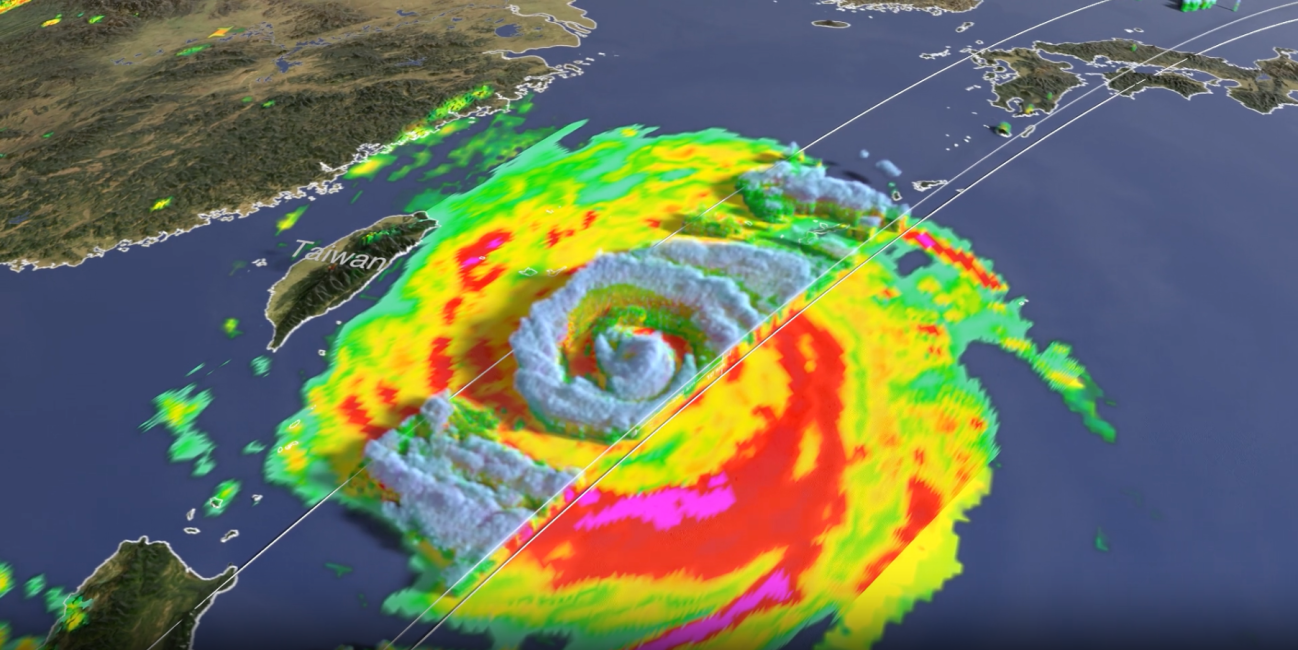
Later that same day, the GPM Core Observatory flew over the center of then Typhoon Bavi at 12:27 UTC (10:08 pm LST) July 10, providing a detailed look into the structure and intensity of the precipitation features within the storm. Surface rainfall estimates from the GPM Microwave Imager (GMI) and Dual-frequency Precipitation Radar (DPR) show a small but intense area of rain (magenta) on the southeast side of the storm’s center that’s part of the inner eyewall. Surrounding this further out from the center is a fairly complete ring of heavy rain (red) that shows an outer eyewall. This type of double eyewall structure is associated with an eyewall replacement cycle, where a secondary eyewall forms outside the original, eventually weakening the original, before then replacing the original eyewall. Eyewall replacement cycles often occur in long-lasting strong tropical cyclones. They lower the peak storm intensity while broadening its wind field.
GPM’s actively scanning DPR allows for a 3D depiction of Bavi’s precipitation field. Areas shaded in blue show frozen precipitation aloft, which mainly consists of snow but can also be in the form of graupel (rimed snow particles) and frozen drops in and around the cores of active thunderstorms.
Here the double eyewall structure is readily apparent with a smaller ring of higher tops surrounded by another ring of higher tops associated with the inner and outer eyewalls, respectively. The two rings of taller tops are separated by a ring of low tops known as a moat where air is sinking between the two eyewalls. At the time of the overpass, Bavi’s maximum sustained winds were reported at 90 mph, making it a category 1 typhoon.
Bavi maintained about this same intensity for another 24 hours as it passed well north of Taiwan and approached the east coast of China. It then weakened slightly with sustained winds estimated by JTWC at 80 mph before making landfall near Yuhuan at around 11:20 pm (15:20 UTC) July 11. The storm then continued to weaken as it moved further inland towards the northwest and then north but brought significant flooding to parts of northeastern China.
This animation shows surface rainfall estimates from NASA’s IMERG precipitation product in association with Super Typhoon Bavi. The animation begins at 00:00 UTC, July 4, 2026, when Bavi was approaching the Northern Marianas as a super typhoon and ends at 23:30 UTC, July 13, 2026, when Bavi’s remnants were located over northeastern China. Alternating light and dark backgrounds indicate the solar cycle.
Credits
First visualization by Alex Kekesi (NASA GSFC / GST) and the NASA Goddard Scientific Visualization Studio using GPM data.
Second visualization by Jason West (NASA GSFC / PPS / KBR)
Story by Steve Lang (NASA GSFC / SSAI)