Alenga

TRMM Sees Powerful Tropical Cyclone Alenga

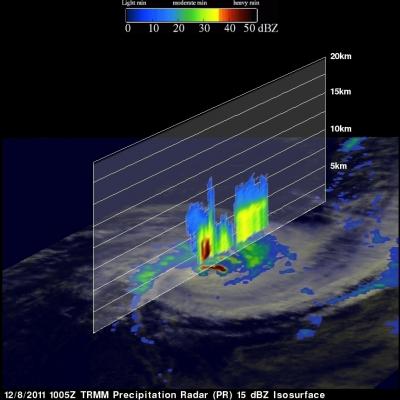
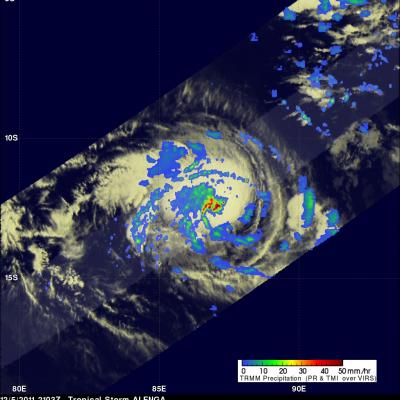
Tropical Cyclone Alenga's wind speeds increased to a maximum of about 90kts (~104 mph). Alenga had weakened from this maximum intensity when the TRMM satellite passed directly above in the early evening of 8 December 2011 at 1005 UTC. A precipitation analysis from TRMM's Microwave Imager (TMI) and Precipitation Radar (PR) are shown above overlaid on a Visible/Infrared image from Visible and InfraRed Scanner (VIRS) data. This analysis shows that very heavy rainfall of over 50 mm/hr (~2 inches) was being produced by intense storms in Alenga's eye wall. The image below shows a 3-D vertical slice

Tropical Storm Alenga Intensifies

The TRMM satellite again passed over intensifying tropical storm Alenga in the South Indian Ocean on 5 December 2011 at 2103 UTC. As expected Alenga had become better organized with TRMM's Precipitation Radar (PR) seeing scattered bands of heavy rainfall spiraling into the center of the storm. Alenga is expected to move south-eastward over the open waters of the South Indian Ocean and reach minimal hurricane force on 7 December 2011. A 3-D image using TRMM PR is shown above. Very powerful storms are shown reaching heights of about 16 km (~9.9 miles). TRMM PR found a reflectivity value of 53.67

TRMM Sees First Tropical Storm Forming In The South Indian Ocean

On 4 December 2011 at 1210 UTC The TRMM satellite had a look at the first tropical storm forming in the Indian Ocean this season. Tropical cyclones normally form in this area between 15 November and 30 April so this one was a little overdue. The "top down" view above shows a rainfall analysis from TRMM Microwave Imager (TMI) and Precipitation Radar (PR) overlaid on an enhanced infrared image from Visible and InfraRed Scanner (VIRS) data. This analysis shows that very heavy rainfall of over 50 mm/hr (~2 inches) was occurring in the forming tropical cyclone near the center of it's circulation