tropical storms

Strong Tropical Storm Harvey Comes Ashore

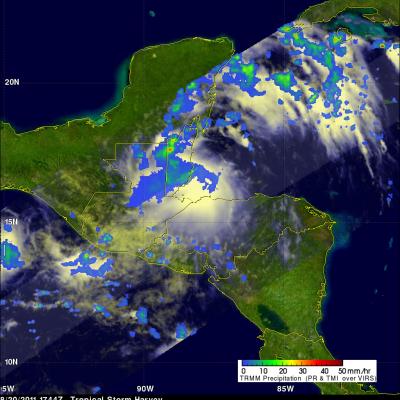
The TRMM satellite had an excellant daylight view of tropical storm Harvey on 20 August 2011 at 1744 UTC ( 1:44 PM EDT) as the storm was coming ashore in Belize. An Air Force Reserve aircraft reported to the National Hurricane Center that Harvey's winds had increased to 63 kts (~72.5 mph) just before landfall. TRMM's Microwave Imager (TMI) and Precipitation Radar (PR) data show that heavy thunderstorms were occurring over land northwest of the storm's center.

Colder Water Chills Fernanda

Ocean water warmer than 26C is a necessary condition for tropical cyclones to support convection. A TMI based Sea Surface Temperature (SST) analysis for three days ending on 18 August 2011 is shown above. Tropical Storm Fernanda's path (overlaid in white) recently took it over ocean waters colder than 26 Celcius so it has weakened considerably. The TRMM satellite passed over Fernanda on 19 August 2011 at 0648 UTC. The TMI and PR rainfall analysis from this pass shows that there is now very little rainfall with the weakening storm. See earlier news about Tropical Storm Fernanda

Tropical Storm Greg Forms

A tropical depression (7E) off the southern coast of Mexico was upgraded by the National Hurricane Center (NHC) to tropical storm Greg shortly after the TRMM satellite saw it on 17 August 2011 at 0534 UTC. TRMM's Microwave Imager (TMI) showed that intense convective thunderstorms within the developing storm were dropping rainfall at rates greater than 30mm/hr (1.2 inches) in an area near the center of the storm. Greg is expected to enhance rainfall over the southwest coastline of mexico for the next day or so. Greg is forecast by the NHC to intensify to hurricane strength within 24 hours while

TD06 Becomes Tropical Storm Fernanda

The National Hurricane Center (NHC) upgraded tropical depression 06E to tropical storm Fernanda on 16 August 2011 at 0800 UTC after seeing data from a TRMM pass at that time. A rainfall analysis from TRMM Microwave Imager (TMI) rainfall data shows that Fernanda contains areas of heavy rainfall. Fernanda was located about 2378 km (~1478 miles) east-southeast of the Hawaiian Islands with wind speeds of about 45 kts (~52 mph) and was moving toward the west at about 8 kts (~9.2 mph). The NHC discussion says that computer guidance indicates considerably more intensification is possible with

Tropical Storm Gert Dissipating

The TRMM satellite showed that tropical Storm Gert still contained a few potent thunderstorms when it traveled directly over head on 16 August 2011 at 0005 UTC. As predicted by the National Hurricane Center (NHC) Gert passed to the east of Bermuda. Gert is now expected to accelerate movement toward the northeast and dissipate in the cold waters of the Atlantic Ocean.

Tropical Storm Gert

Tropical Storm Gert became the seventh named tropical cyclone in the Atlantic Ocean basin on Sunday August 14, 2011 at 1800 UTC ( 2 PM EDT). Gert was located southeast of Bermuda and appeared small but well organized when the TRMM satellite flew over on 15 August 2011 at 0101 UTC. A rainfall analysis from TRMM's Microwave Imager (TMI) shows a comma shaped area of moderate to heavy rainfall wrapping around the center of the small storm. The National Hurricane Center (NHC) expects Gert to intensify slightly while passing just to the east of Bermuda. Click here to see earlier TRMM information

Short-Lived Tropical Storm Franklin

Tropical Storm Franklin was only active for a short time but the TRMM satellite had a fairly good view when it passed above on Saturday August 13 at 0115 UTC. TRMM's Microwave Imager (TMI data shows that Franklin was dropping some light to moderate rainfall north-northeast of Bermuda. Franklin became extra-tropical a little later as it moved into the open waters of the north Atlantic.

Tropical Storm Emily Rainfall

The TRMM-based, near-real time Multi-satellite Precipitation Analysis (TMPA) at the NASA Goddard Space Flight Center provides estimates of rainfall over the global Tropics. TMPA rainfall totals associated with tropical storm Emily are shown for the period from 1 to 8 August 2011. Approximate locations for Emily are shown with appropriate red symbols and the storm's 0000Z positions were labeled. The TMPA analysis above indicates that Emily dropped the heaviest rainfall totals of close to 300 mm (~11.8 inches) in the Caribbean Sea south of the Dominican Republic. Tropical storm Emily formed near

Tropical Storm Emily Weakens but May Revive

Tropical Storm Emily dissipated after being disrupted by the mountains of Hispaniola but according to the National Hurricane Center (NHC), may revive again within a couple days while moving toward the northwest. The TRMM rainfall analysis on the right, from a TRMM orbit on 4 August 2011 at 0934 UTC ( 5:34 AM EDT), shows that heavy rainfall was being produced by the dissipating storm over southern Haiti and the Dominican Republic at that time. See more news about Tropical Storm Emily