
Natural Cycles in Global Precipitation
In many places, the amount of that rain falls on a particular day or hour is influenced by multiple natural cycles that exist simultaneously on different time scales. One such cycle repeats every 24 hours, and another repeats every year.
The global extent of these cycles can be studied using NASA's IMERG precipitation estimates that have been generated for 1998 to the present. Most of Earth's precipitation falls as rain, and the rest falls as snow, hail, or other forms of precipitation.
The length of IMERG's data record makes it possible to average out some of the random error and unrelated weather fluctuation. For example, any 100-year storm that occurs around the globe each year would do more to obscure the underlying daily and annual cycle of rainfall in a dataset that was shorter than IMERG's 28 years. IMERG stands for "Integrated Multi-satellitE Retrievals for the Global Precipitation Measurement (GPM) Mission." The IMERG algorithm is developed by a team of scientists, most of whom are affiliated with NASA Goddard Space Flight Center (Huffman et al. 2023a, 2023b, 2023c).
IMERG precipitation estimates give a more complete picture of Earth's natural cycles because the dataset has high resolution and global extent. IMERG covers both continents and oceans because it is input data comes from a constellation of satellites that observe the Earth in the microwave, visible, and infrared spectrum. Over decades, individual satellites have joined and dropped out of this constellation like the changing lineup of a professional sports team.
IMERG is available every 30 minutes, globally, at a resolution of no less than 7 miles. IMERG provides estimates every 0.1 degrees of latitude and longitude, which equates to about every 7 miles at the Equator and less near the poles.
As described in an earlier article, you can browse through all of these 30-minute snapshots by visiting NASA's World View webpage. Natural cycles can be hard to see by flipping through a series of 30-minute estimates. These cycles are easier to see if one first calculates average conditions and then calculates the time-varying deviation from these averages. This approach is followed here.
The daily cycle
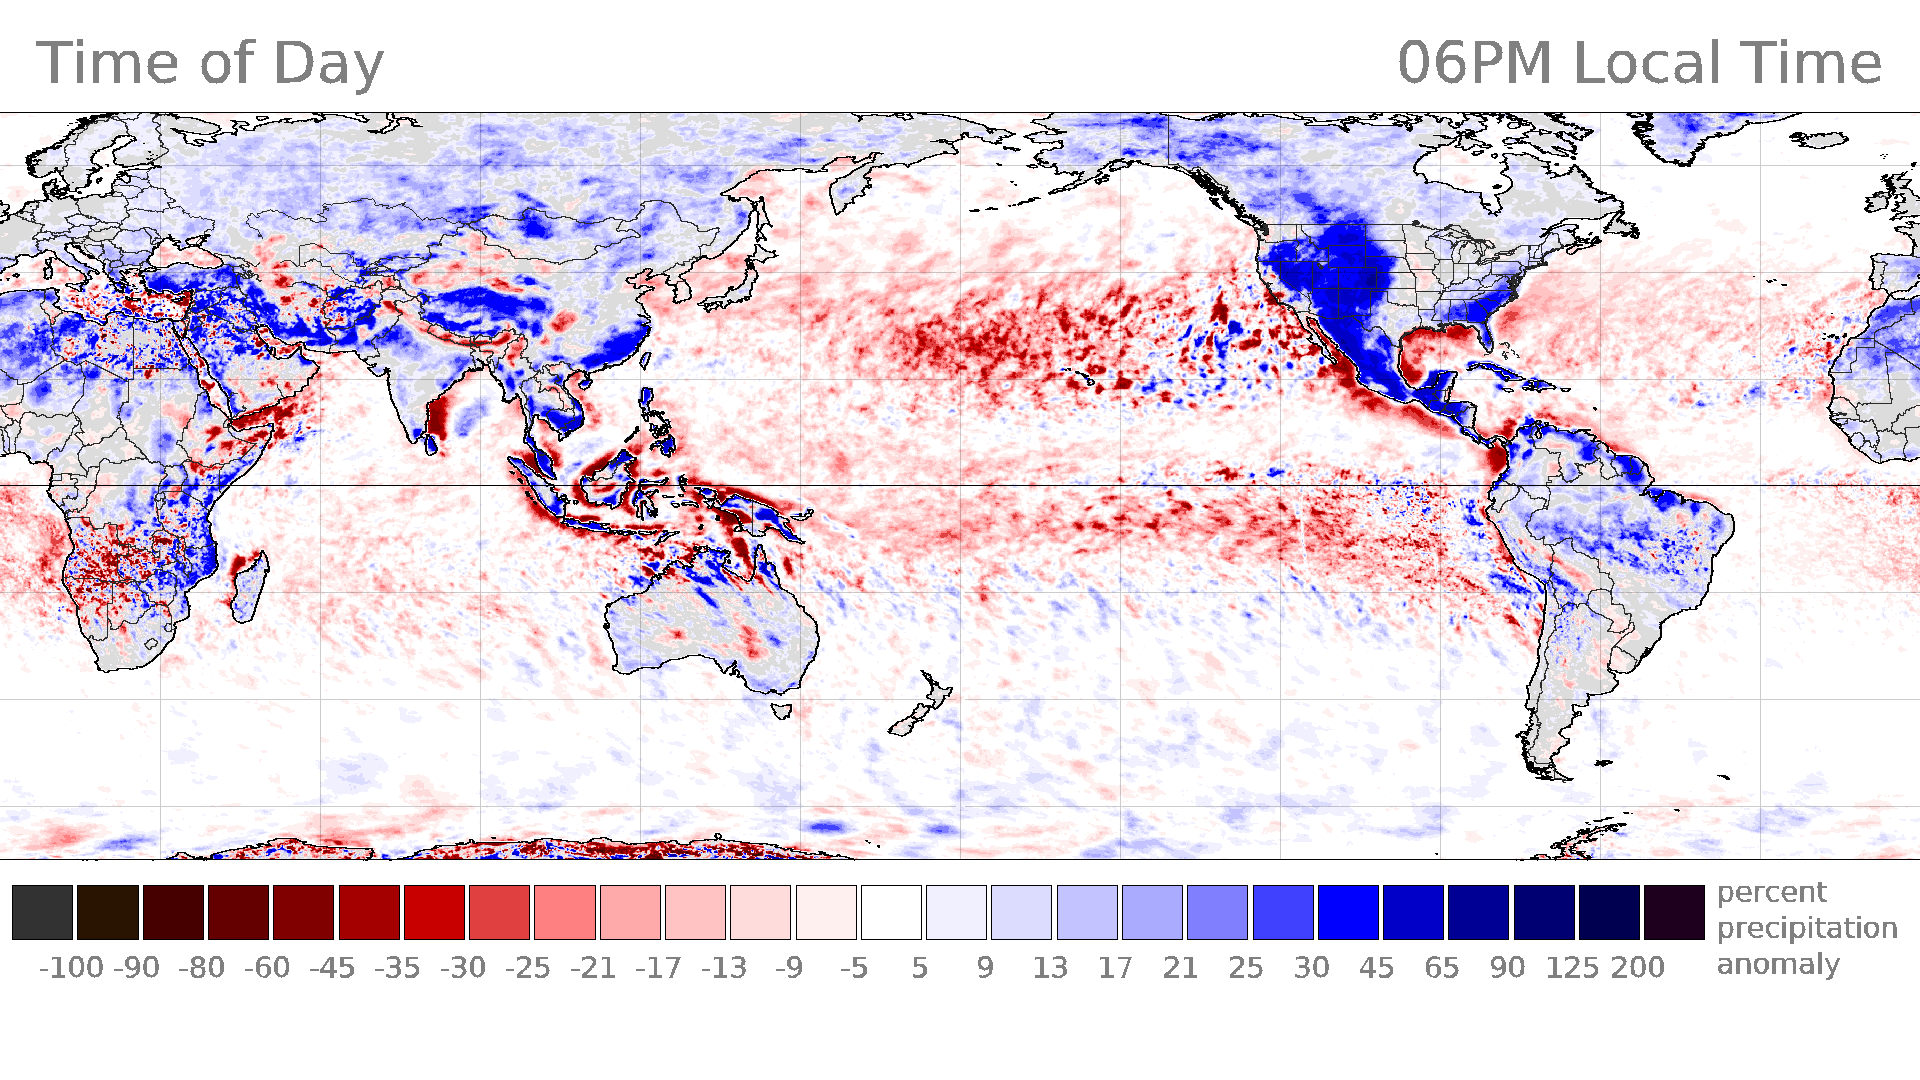
During some seasons and in some places, the average amount of precipitation varies with the time of day. Atmospheric scientists call this type of variation the diurnal cycle, and IMERG has been used to study this cycle (e.g., Tan et al. 2019, Watters and Battaglia 2019, Xiong et al. 2025, and Patel 2020). The diurnal cycle during July is shown in the animation below for 70º South to 70º North latitude. A single month of the year was chosen for this animation because, in many places, the diurnal cycle is different in summer and winter.
Precipitation varies with time of day during July, averaging over 1998–2025. To download this video, click here.
To reduce noise, each frame of the animation covers a 12-hour period. For example, the first frame is centered on 6 AM local time and summarizes IMERG observations for midnight through noon during all Julys between 1998 and 2025. Each 12-hour frame starts 30 minutes later than the prior frame, so the second frame covers 12:30AM at night through 12:30PM in the early afternoon.
For a particular 12-hour period, the image is white where the precipitation rate equals the average rate for the whole day. Deep blue or red indicates large deviations from average conditions. Specifically, deep blue indicates that the 12-hour period has a precipitation rate that is about 50% higher than average and deep red indicates a rate 50% lower than average. The color bar was constructed with units of percent deviation from average conditions. Doing so makes the diurnal cycle easy to see in deserts and other arid locations, not just places that receive more rain.
As you examine the daily-cycle animation, it is important to understand how time is represented. A single frame of the animation shows data for the same range of local times everywhere on Earth. In contrast, a snapshot of the Earth would always show the full 24-hour range of local time as a function of longitude.
The speckle of fine-scale variation that is seen in each of these 12-hour averages demonstrates the high variability of rainfall and snowfall in both space and time. More than a hundred thousand 30-minute IMERG estimates were averaged together to produce each 12-hour image, and even this approach is insufficient to smooth out fine-scale geographic variation due to the influence of individual storms. In the face of nature's variability, only a broad picture of the global, daily cycle of rainfall emerges from IMERG, a data product that represents NASA's effort to optimally combine 28 years of observations from a constellation of geosynchronous and polar-orbiting satellites.
The daily cycle over land or ocean
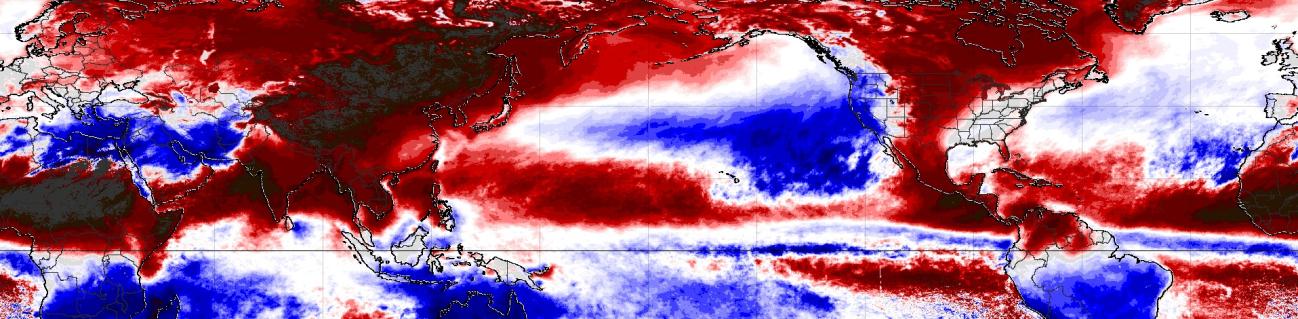
Below, a single frame is extracted from the previous animation in order to illustrate the rule of thumb that rain tends to fall over land in the late afternoon and over ocean in the early morning.
The physical basis for this rule of thumb is that, unless it's cloudy, the sun warms the land surface throughout the day, creating maximum atmospheric instability in the afternoon. This instability can trigger storms that persist for several hours as they are carried by the prevailing winds. In contrast, the temperature of the ocean surface changes very little most days because it takes much more energy to increase the temperature of water vs. that of air. Over the ocean, the nighttime cooling of the tops of clouds increases atmospheric instability and can trigger storms around sunrise. The image below shows these patterns in IMERG data.
Over Asia and North America, the percent difference calculated from the afternoon-evening precipitation rate (noon to midnight local time) minus the daily-average precipitation rate.
The image shows afternoon and evening rainfall, averaging observation made from local noon to midnight during all Julys from 1998 to 2025. In this image, many land areas are dark blue, which indicates it rains there predominantly in the afternoon and evening. In contrast, much of the ocean is dark red, indicating that little precipitation falls there in the afternoon or evening.
Mountains affect the daily cycle of precipitation
As just described, enhanced rainfall in the afternoon or evening is common over land, but mountain ranges can modify this pattern. For example, the Rocky Mountains have an early afternoon precipitation maximum, but strong storm systems triggered by these mountains often persist for hours as the prevailing wind carries them hundreds of miles to the east. The many storms that follow this track result in peak precipitation occurring later in the day east of the Rockies.
The Rocky Mountains' impact is easy to see in the following cross section with longitude on its horizontal axis and time on the vertical axis. This kind of diagram is a called a Hovmoller diagram, and the one below is constructed for a west-east slice of the United States. The slice covers 35º to 40º North latitude, which includes San Francisco east to Denver, St. Louis, and Washington DC. The diagram combines all IMERG data for July during 1998–2025.
Looking at the diagram, it is clear that the rainiest part of the day is early afternoon in Denver and 12 hours later 850 miles east in St. Louis.
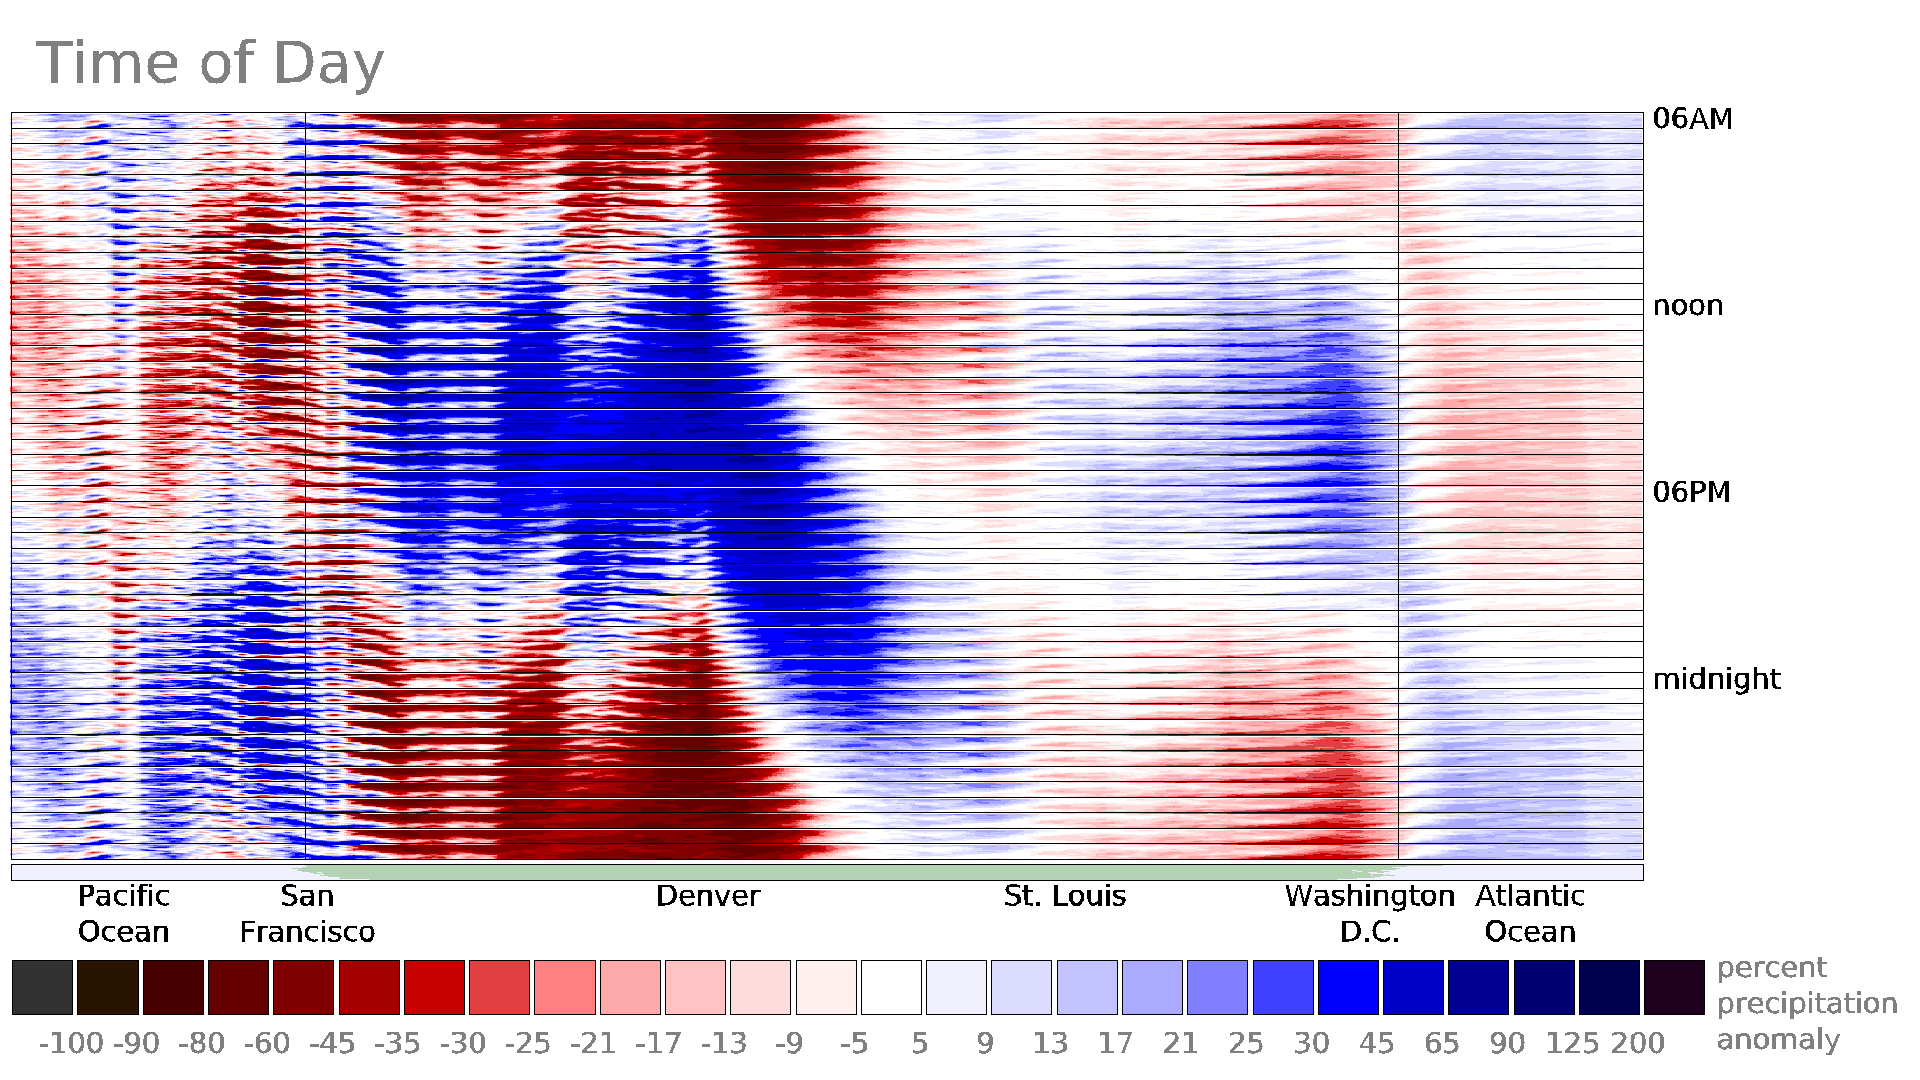
Precipitation variation over the United States in July during 1998–2025, as function of longitude and time of day. To download this video, click here.
The just described geographic variation of the daily cycle has implications for the constellation of satellites necessary to create global precipitation datasets that capture this natural cycle. It would not be possible to study precipitation's diurnal variation with satellites that only observed the Earth at a fixed set of one or two local times in the afternoon and evening. During the IMERG era, Earth-observing satellites with microwave instruments, fortunately, have been stationed in a wide range of orbits, as depicted in an overflight-time plot generated by NASA.
One way to check that the diurnal patterns that IMERG sees around the globe are reasonable is by comparing them against regional high-quality independent datasets. For example, over the lower 48 states of the United States, there is a network of 150 weather radars operated by the National Weather Service. Data from these radars are shown every day on TV and online weather forecasts. Figure 6 of Sungmin and Kirstetter (2018) shows that this ground-radar data has a similar diurnal pattern to that shown in the IMERG diagram above.
The Annual cycle
Rainy and dry seasons are annual occurrences in some parts of the world. The timing of the wet season onset is economically significant and difficult to forecast. Scientists have used IMERG to forecast the onset and spatial pattern of the summer rainy season over India, West Africa, and Florida (Jayasankar and Misra 2025a; 2025b; Misra and Jayasankar 2024; GPM website). Other studies have used IMERG as a reference dataset to evaluate the accuracy of model forecasts of the rainy season over the watershed that supplies the Nile River (Gebremichael et al., 2025). Satellite-based precipitation estimates are the only hope here because there are too few rain gauges and weather radars in Africa for them to verify model forecasts of Nile River flow.
The following IMERG animation shows the annual cycle of precipitation across the world and has frames that each summarize a 30-day period. The first frame, for example, includes data from the first 30 days of 28 years (1998–2025). The next frame starts and ends two days later than the first frame. The yellow dot that moves north and south between 23.5°S and 23.5°N latitude indicates the latitude at which the noon sun is directly overhead during that time of the year.
As the previous section described for daily cycle, the animation below uses a similar red-blue color table to identify dry and wet anomalies in the annual cycle. For a particular 30-day period, the image is red or blue where the precipitation rate is less than or more than the annual average precipitation rate. In this way, this animation shows deviation from average conditions. In contrast, the GPM website's Precipitation Climatology page shows the annual cycle of precipitation amount rather than the time-varying deviation from average conditions.
The annual cycle, showing how precipitation varies by day of year. To download this video, click here.
As noted previously about the daily cycle, IMERG's depiction of the annual cycle also contains strong small-scale variations that show up as speckles in the animation. NASA has expended considerable effort to extend the IMERG dataset back to 1998 in part because a long dataset is necessary to damp down the impact of individual weather events and to reveal underlying regional variation in the annual precipitation cycle.
The annual cycle and the sun
Over continents, there are many places that receive much of their rain during the summer. In both the Northern and Southern Hemispheres, summer starts in the part of the year when the sun is highest in the sky. This north-south migration of large precipitation accumulations can be seen in a time-vs.-latitude diagram, such as the one below. This diagram includes IMERG data from 50º to 60º East longitude, which includes locations from South Africa north to Finland. The line of yellow dots in this diagram shows the latitude at which the sun is directly overhead at noon.
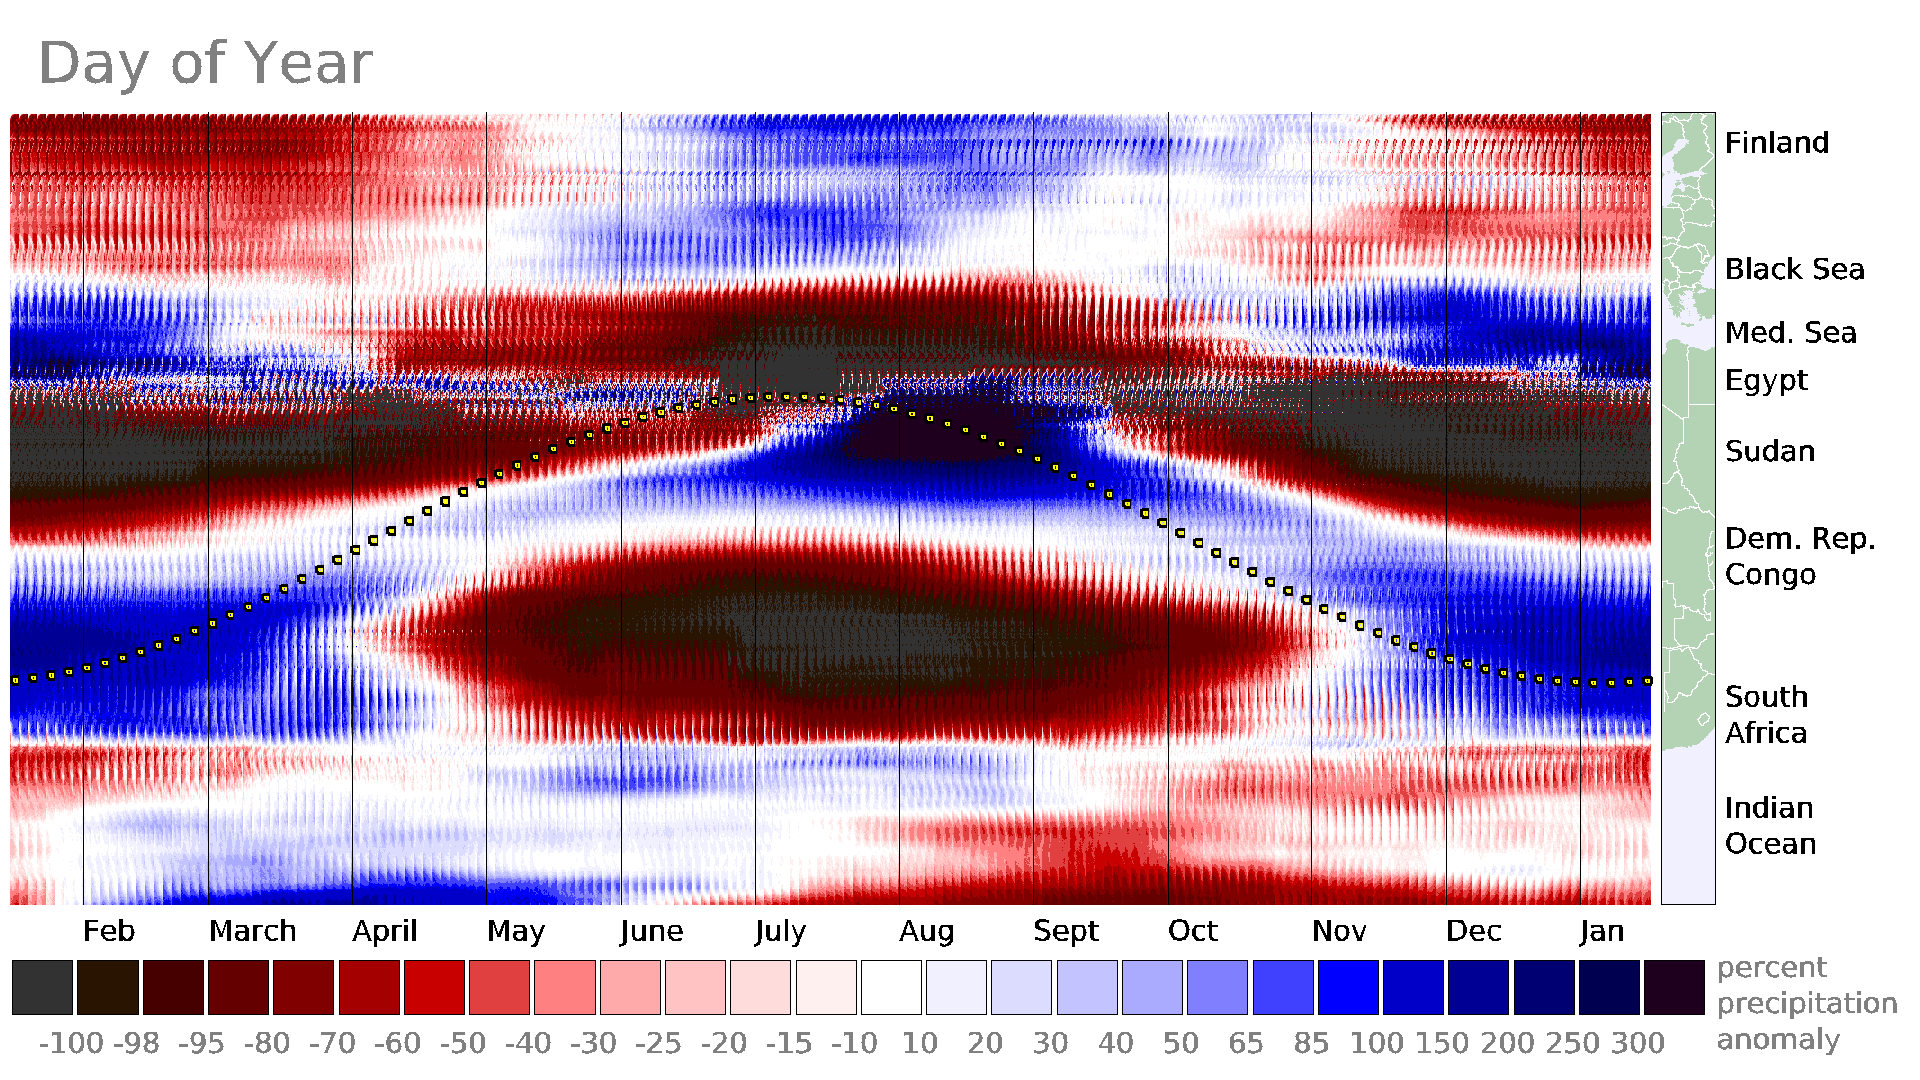
A time-vs.-latitude cross section of the annual cycle of IMERG precipitation through a north-south section through Africa and Europe.
The rule of thumb that summer is the rainy season does not apply to ocean (Fig. 7, Huffman et al. 2023) or even to some land areas. For example, the image below averages data over the United States for all Januarys from 1998 to 2025. Blue over California, Oregon, and Washington indicates that January is typically a wet month on the West Coast. Red over the central United States indicates that little of the year's precipitation falls there in January most years. The gray over the eastern United States indicates that precipitation in January typically accumulates at close to the average annual rate there.
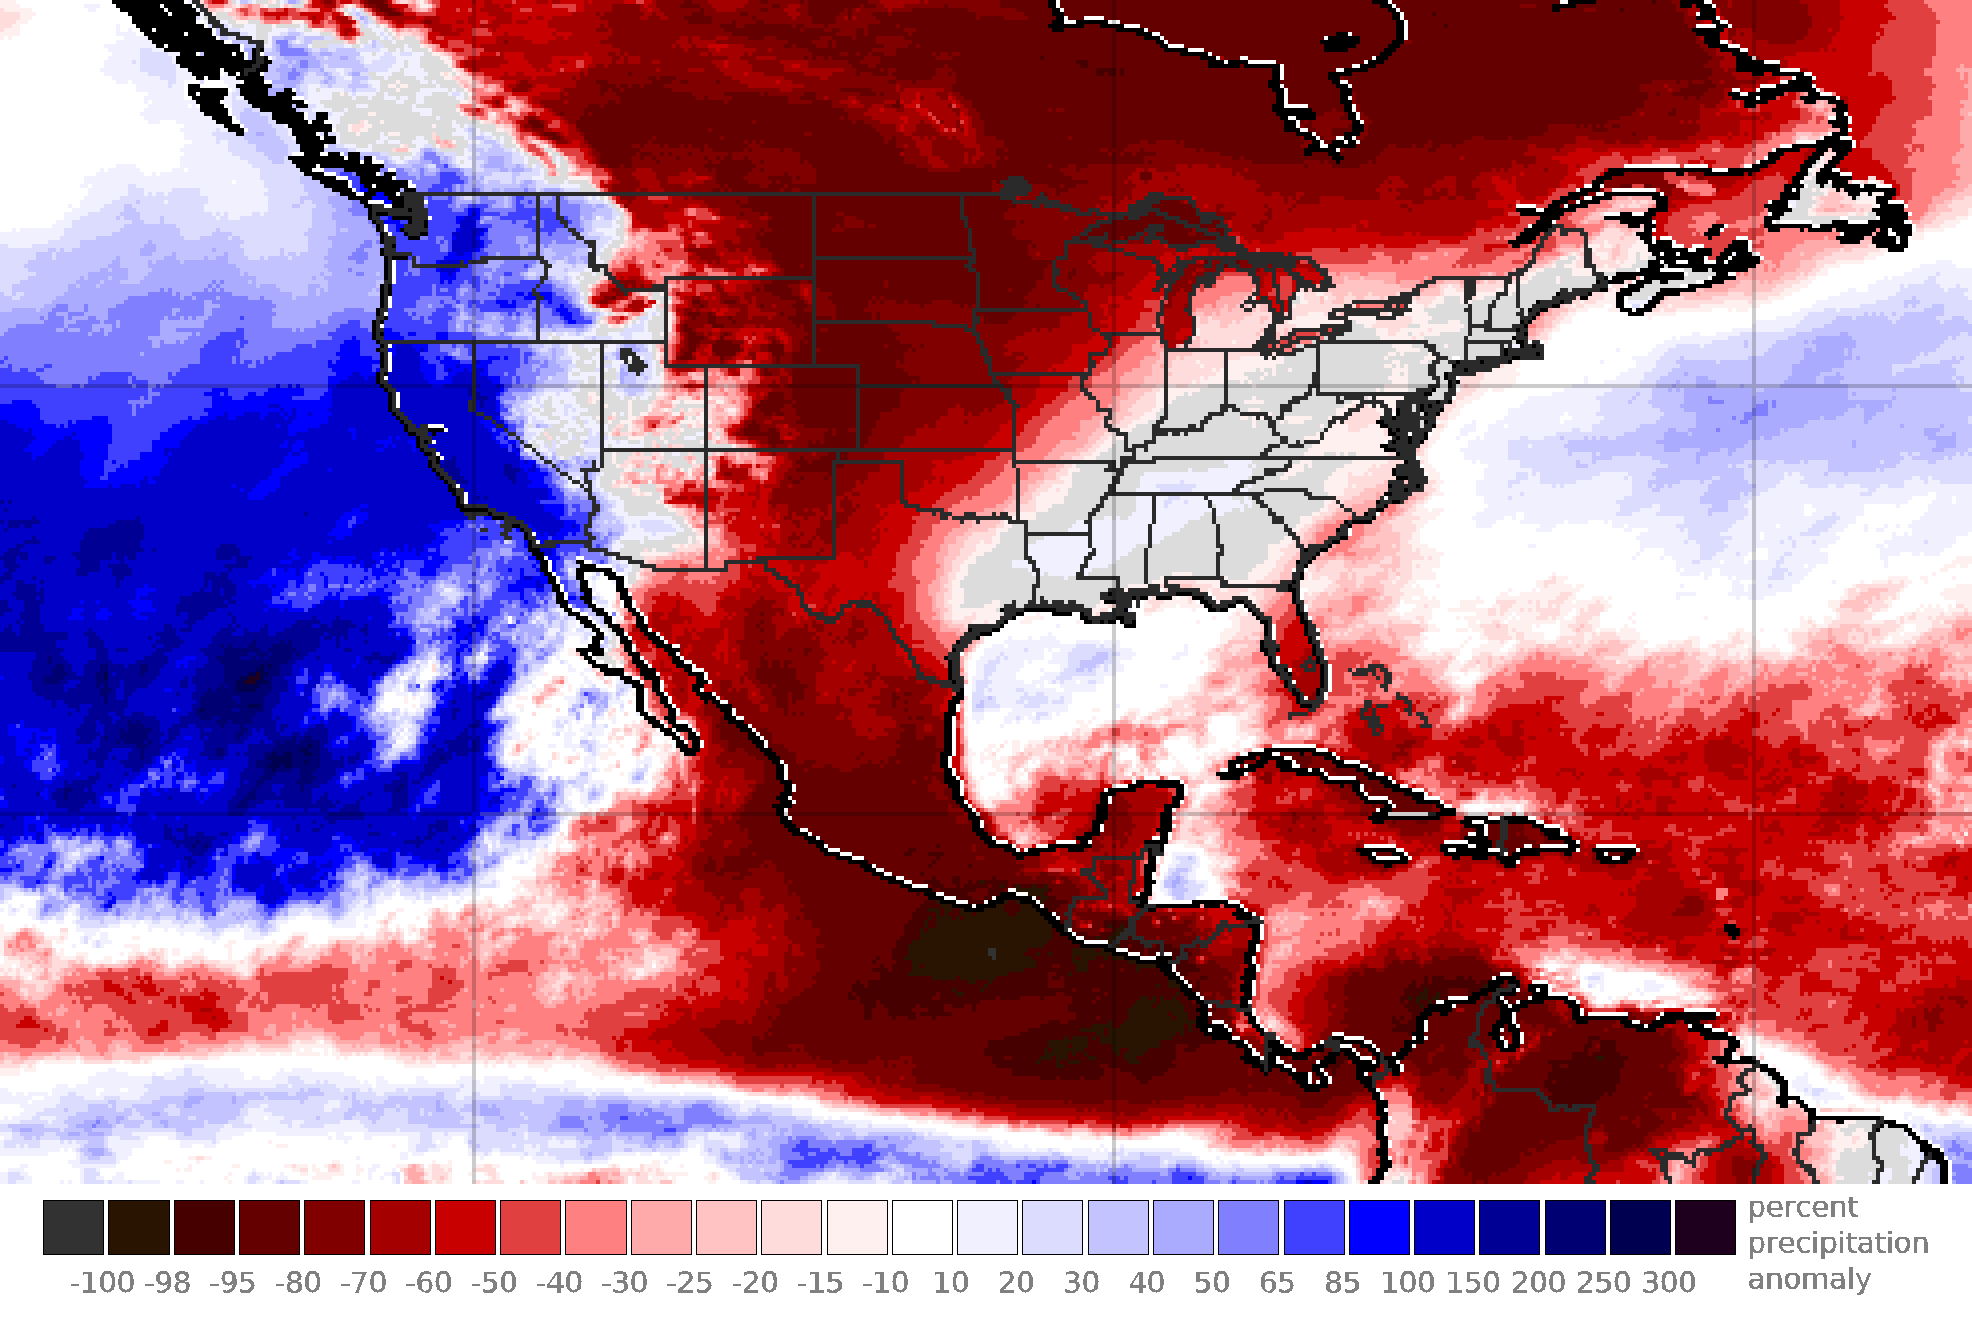
Average January precipitation over the United States relative to annual-average precipitation.
Another way to explore the seasonal variation of precipitation over the United States is with a time-series diagram. Below is a time-series plot of three regions: the Pacific Northwest, the Great Plains of the central U.S., and the mid-Atlantic. The inset map shows these three regions. Each region's median value is shown with dark dots, and the shaded area shows the middle 50% of IMERG values in the region. The horizontal axis is the day of year and the vertical axis is the long-term average precipitation rate for 30-day periods within the annual cycle. Cyan is used for Pacific Northwest, tan for the Great Plains, and light green for the mid-Atlantic region.
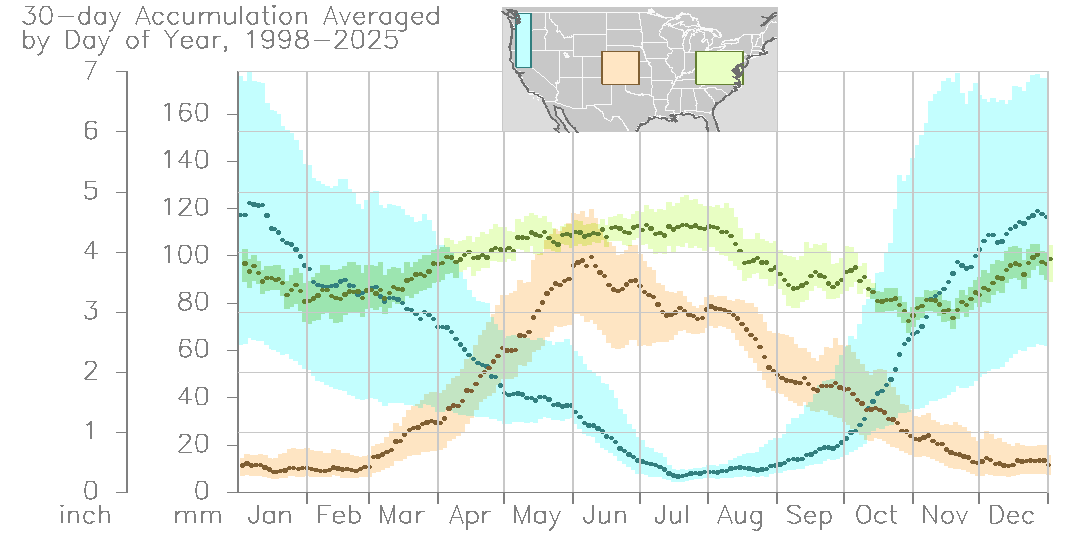
A time series for three regions of the United States that shows how their seasonal precipitation patterns differ.
Two of these three regions have peak precipitation near the time of the year that the sun is highest in the sky. The summertime peak is more pronounced over the Great Plains than over the mid-Atlantic. The Pacific Northwest, in contrast, has most of its annual precipitation fall in winter when it receives the least solar heating but is soaked by numerous storms coming off the ocean. A similar pattern is seen if the time series is calculated from NOAA ground-radar data (not shown) instead of IMERG data.
Final thoughts
NASA's IMERG precipitation data contains daily and annual cycles. These natural cycles are easier to see if one examines deviations from average conditions. The daily and annual cycles are present in the 3.2 trillion precipitation values that make up the IMERG dataset for 1998 through the present.[1]
The IMERG algorithm is run and archived at NASA Goddard Space Flight Center. The Center also hosts the team of scientists who develops the IMERG algorithm. For more information about IMERG and the Global Precipitation Measurement (GPM) Mission, please visit the GPM website, at http://gpm.nasa.gov. Credit: Imagery and caption by Owen Kelley (NASA PPS / GMU CEOSR).
[1] 3.18x10¹² IMERG precipitation values, which is derived from the following expression: (3600 longitude grid boxes) (1800 latitude grid boxes) (48 estimates per day) (365.25 days per year) (28 years).