
GPM Examines Tropical Cyclone Chapala

Tropical Cyclone Chapala developed in the very warm waters of the Arabian Sea west of India on October 28, 2015. These images show rainfall derived from data collected by GPM's Microwave Imager (GMI) and Dual-Frequency Precipitation Radar (DPR) instruments. The GPM core observatory satellite had good views of the tropical cyclone on October 29, 2015 at 0332 and 1456 UTC. GPM's rainfall from the first pass show that Chapala was close to hurricane intensity with the location of a developing eye clearly shown by GMI. By the second pass Chapala's maximum sustained winds were estimated at 65 kts (75mph) making it a category one on the Saffir-Simpson hurricane wind scale.
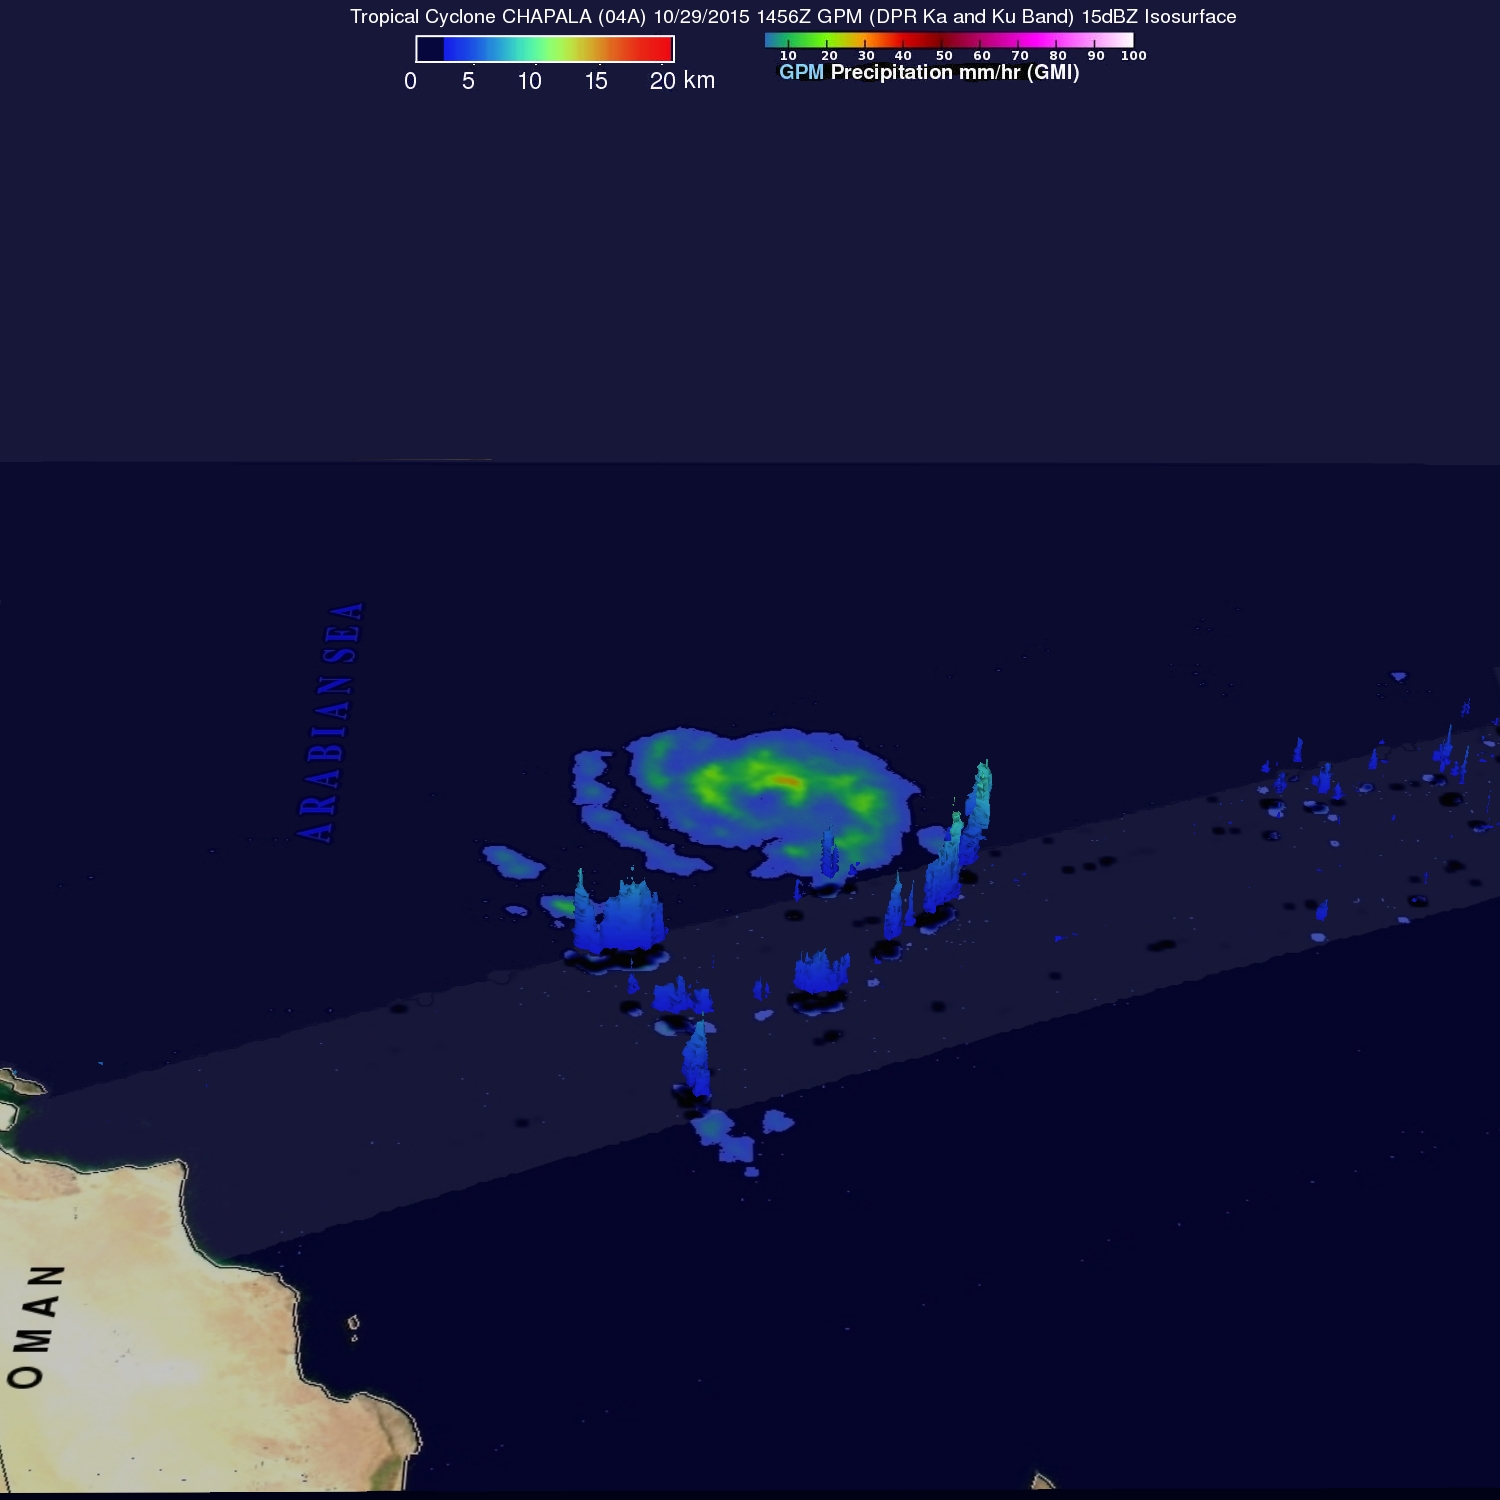
Precipitation around the small tropical cyclone was found by GMI to be only light to moderate. Rain near the center was measured falling at a rate of slightly more than 28 mm (1.1 inches) per hour with the first pass and 31.9 mm (1.3 inches) per hour in the second examination. The 3-D vertical structure of feeder bands and other scattered storms around Chapala's center is shown in these views using from GPM's Ka and Ku bands radar (DPR) reflectivity data. The radar swath is shown in a lighter shade of blue. With the first pass GPM radar measured rain in the storms in the feeder band on Chapala's eastern side dropping rain at a rate of over almost 64 mm (2.5 inches) per hour. Storm top heights were measured by GPM's radar reaching altitudes up to 15 km (9.3 miles) in the feeder band but most storm top heights were much lower.
Chapala is predicted by the Joint Typhoon Warning Center (JTWC) to intensify and have peak winds of 115 kts (132 mph) in a couple days. The tropical cyclone is then predicted to weaken slightly but still have hurricane force winds before hitting Yemen on October 2, 2015.