
GPM Measures Tropical Storm Saola's Rainfall
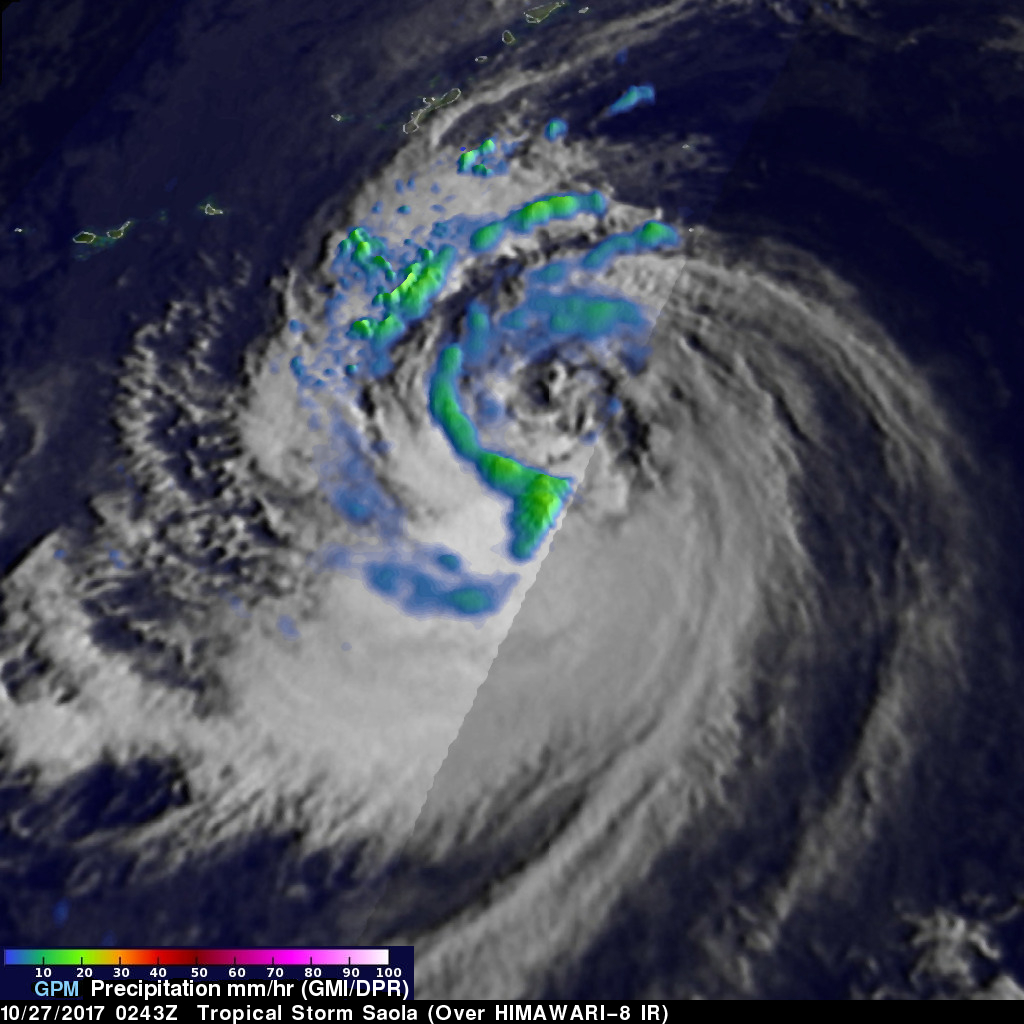
The GPM core observatory had a fairly good view of tropical storm Saola on October 27, 2017 at 0243 UTC. This image shows the GPM satellite's coverage (lighter shades) of surface rainfall around tropical storm Saola. GPM's Microwave Imager (GMI) and Dual-Frequency Precipitation Radar (DPR) instruments received data showing the intensity of rainfall over the western half of tropical storm Saola. GPM's radar (DPR Ku Band) discovered that rain was falling at a rate of over 66 mm (2.6 inches) per hour in feeder bands wrapping around that side of the tropical storm. The most intense convective storms appeared to be located in the southern part the system where the GPM pass didn't provide complete coverage.
This 3-D animation revealed the relative heights of precipitation within tropical storm Saola. The animation was produced by blending measurements from GPM's radar (DPR Ku band) with cloud top heights that were based on the HIMAWARI-8 satellite's infrared image temperatures. Storm tops within feeder bands on Saola's western side were found by GPM's radar to reach heights of above 13.5 km (8.4 mile). The structure of clouds within tropical storm Saola's partially exposed center of circulation are shown with this close-up virtual flyby.
The Joint Typhoon Warning Center (JTWC) predicts that Saola will have peak intensity tomorrow and may briefly be a typhoon with winds of 65 kts (75 mph). Saola is expected to be a weakening tropical storm when it brushes the southern edge of the Japanese islands of Kyushu, Shikoku and Honshu.