Heavy Rainfall Across the U.S. Measured from Space
For close to two weeks the combination of a nearly stationary front and tropical moisture caused almost continuous precipitation over much of the Mid-Atlantic. Record amounts of rain fell over the eastern United States with over a foot of rain reported in some parts of the Mid-Atlantic. The excessive rain led to flooding along several rivers including the Potomac river.
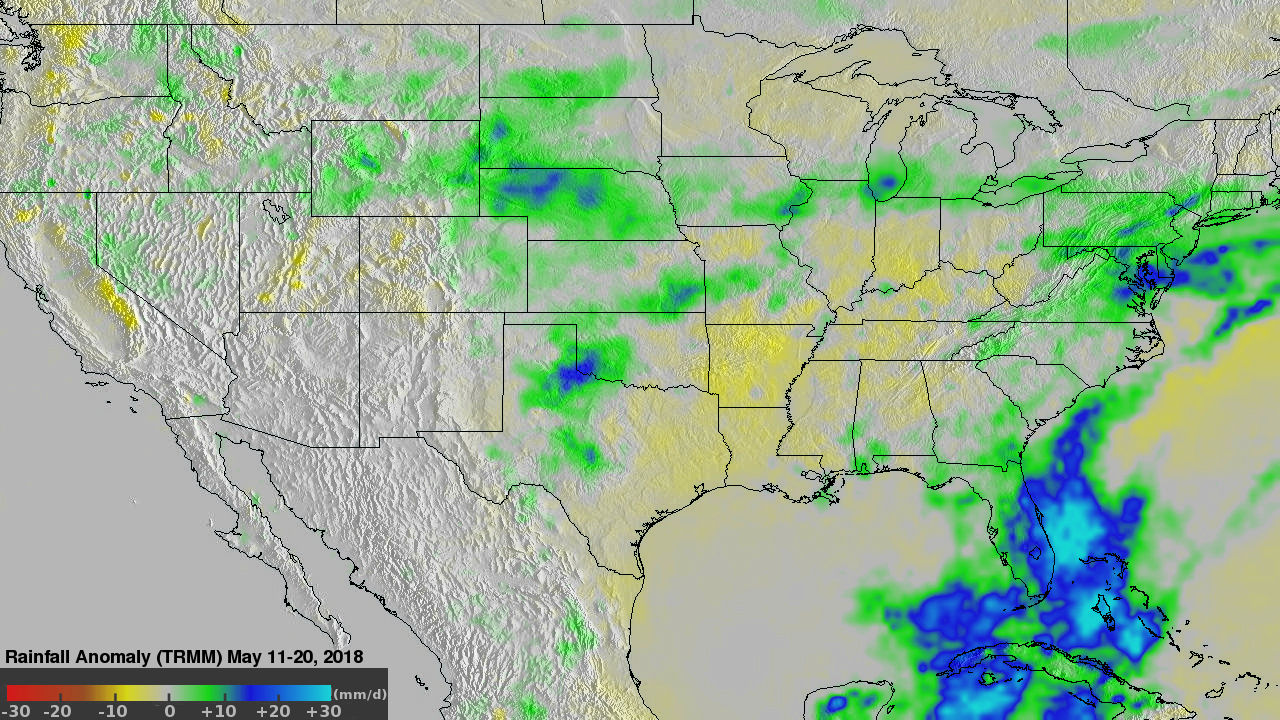
This image shows anomalous rainfall for the period from May 11-20, 2018. This analysis used climatology data that were based on measurements by the Tropical Rainfall Measuring Mission (TRMM) satellite from 1997- 2015. The TRMM satellite collected data that contributed to a unique dataset of global tropical rainfall. This rainfall anomaly analysis was made possible by comparing rainfall data compiled during the twelve year period from 2001-2012 to "near real-time" Multi-satellite Precipitation Analysis (TMPA-RT 3B42RT) data. This analysis indicates that Mid-Atlantic rain was falling at a rate of greater than 15 mm (.59 inches) per day above normal (blue). It also indicates that the Mississippi valley was receiving less than normal rainfall during the same period (yellow). Much of the desert Southwest was receiving the same or lower than normal precipitation.
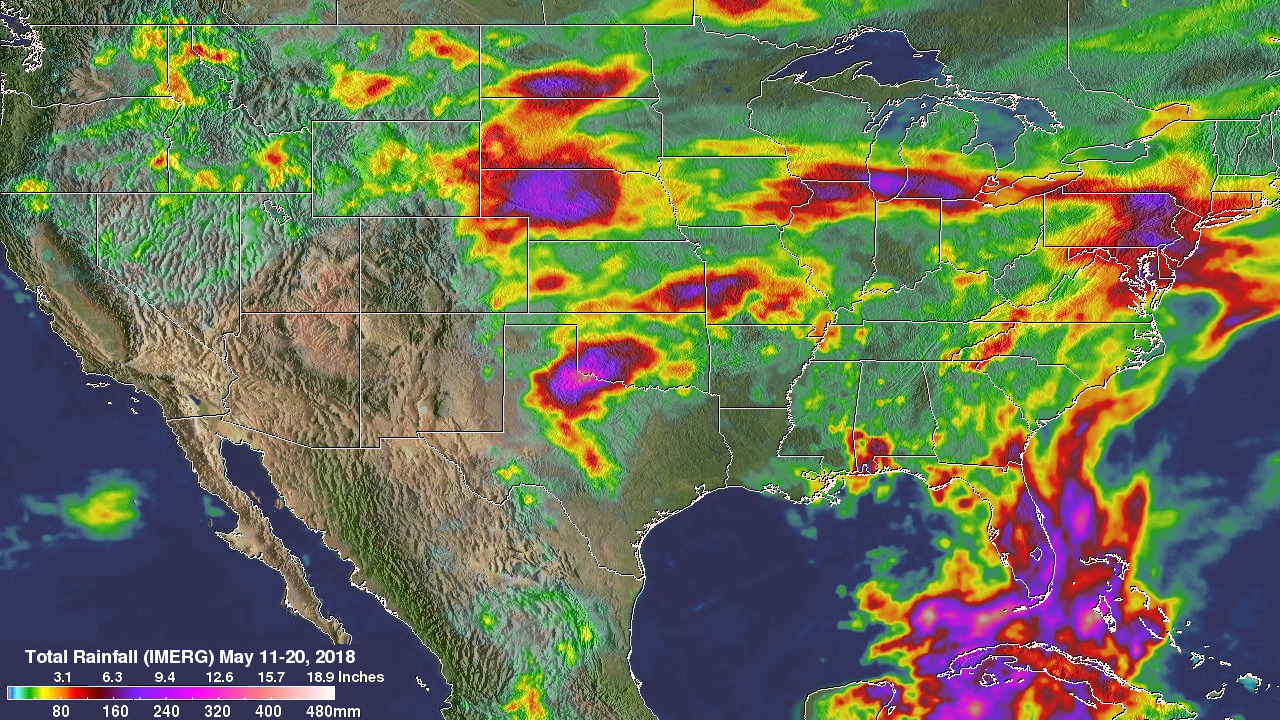
This estimate of accumulated rainfall over the continental United States was made possible using Multi-satellitE Retrievals data (IMERG). Algorithms developed by NASA's Precipitation Measurement Missions (PMM) science team were used to merge data from the satellites in the GPM Constellation. IMERG data collected during during the period from May 11-20, 2018 were added together to produce an estimate of total rainfall.