
Tropical Cyclone Ava Viewed By GPM
Tropical cyclone AVA formed in the southeast Indian Ocean northeast of Madagascar on January 2, 2018. AVA became increasingly powerful and approached the eastern coast of Madagascar with maximum sustained winds estimated to be greater than 90 kts (103.5 mph). AVA has been interacting with land and wind speeds near Tamatave, Madagascar have been reported to be 70 kts (80.5 mph). The Joint Typhoon Warning Center (JTWC) predicts that tropical cyclone AVA will move to the south along Madagascar's eastern coast for a day or so and then return to the Indian Ocean. Very heavy rainfall is expected to accompany the tropical cyclone and may result in deadly flooding and landslides. The United Nations Office For the Coordination of Humanitarian Affairs has compared tropical cyclone AVA to Tropical Cyclone Jade that hit Madagascar in 2009. Tropical Cyclone Jade affected 61,000 people and caused 15 deaths.
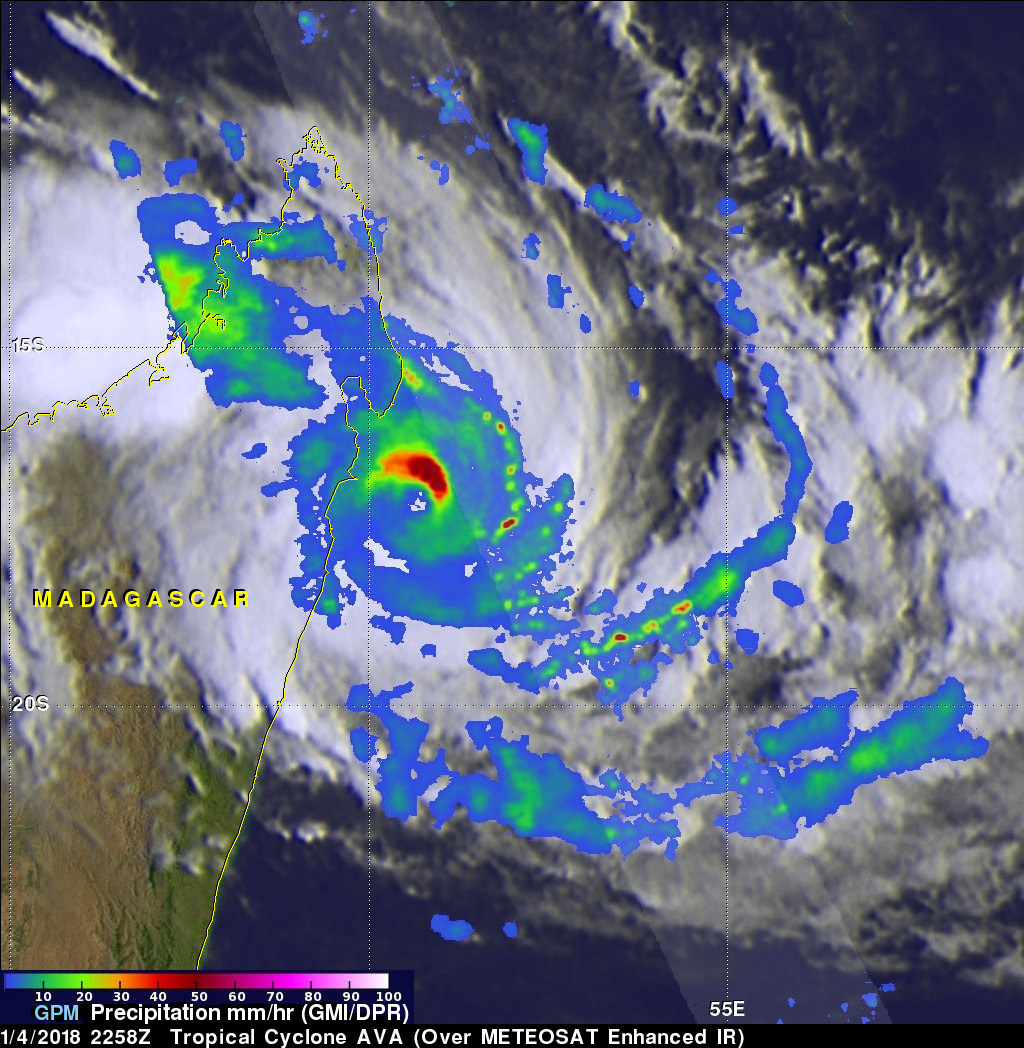
The GPM core observatory satellite passed over northeastern Madagascar on January 4, 2018 at 2258 UTC (January 5, 2018 at 0158 local time). Data collected by GPM's Microwave Imager (GMI) and Dual Frequency Precipitation Radar (DPR) instruments showed that extremely heavy rainfall was being produced by the tropical cyclone. GPM's radar (DPR Ku band) data indicated that rain was falling at a rate of greater than 194 mm (7.7 inches) per hour in a few of the powerful storms wrapping around the tropical cyclone. Extremely heavy rainfall is also shown by GMI in a large area of precipitation northeast of AVA's eye.
This 3-D animation showing cloud top heights within tropical cyclone AVA was made possible by GPM's radar (DPR Ku Band). DPR's Ku Band instrument provided three dimensional measurements of precipitation within a 152 mile (245 km) wide swath east of tropical cyclone AVA's center. DPR found that a few storm tops east of Madagascar were reaching heights above 13km (8.1 miles). Cloud top heights over a larger area were produced by blending measurements from GPM's radar (DPR Ku band) with cloud top heights based on the Meteosat satellite's infrared temperatures. Cloud top heights were color enhanced in this animation. Blue was used for heights near the ocean surface and pale green/yellow was assigned to cloud tops with heights close to 13 km (8.1 miles).