
Monsoon brings Heavy Rain to Parts of Australia
Thousands of people were asked to evacuate recently as parts of northern and eastern Australia felt the effects of heavy rains brought about by the summer monsoon. Though not expected to be as bad as last year, when dozens of people were killed and tens of thousands of homes were flooded, the recent heavy rains have led to flash flooding and landslides in Queensland and caused rivers to overflow their banks in New South Wales.
The monsoon plays a prominent role in the annual rainfall cycle over Australia. A monsoon is a seasonal phenomenon wherein an area of low pressure forms over a large land mass, in this case the Australian continent, during local summer. Because of the large heat capacity of water, land heats up much faster than water. This forces air to rise over the hotter land surface, which induces low pressure to form at the surface. The low pressure in turn then draws moist air in from the surrounding ocean, becoming a focus for shower and rain activity.
Back in November of 1997, NASA collaborated with the Japanese space agency JAXA to launch the Tropical Rainfall Measuring Mission satellite (better known as TRMM).
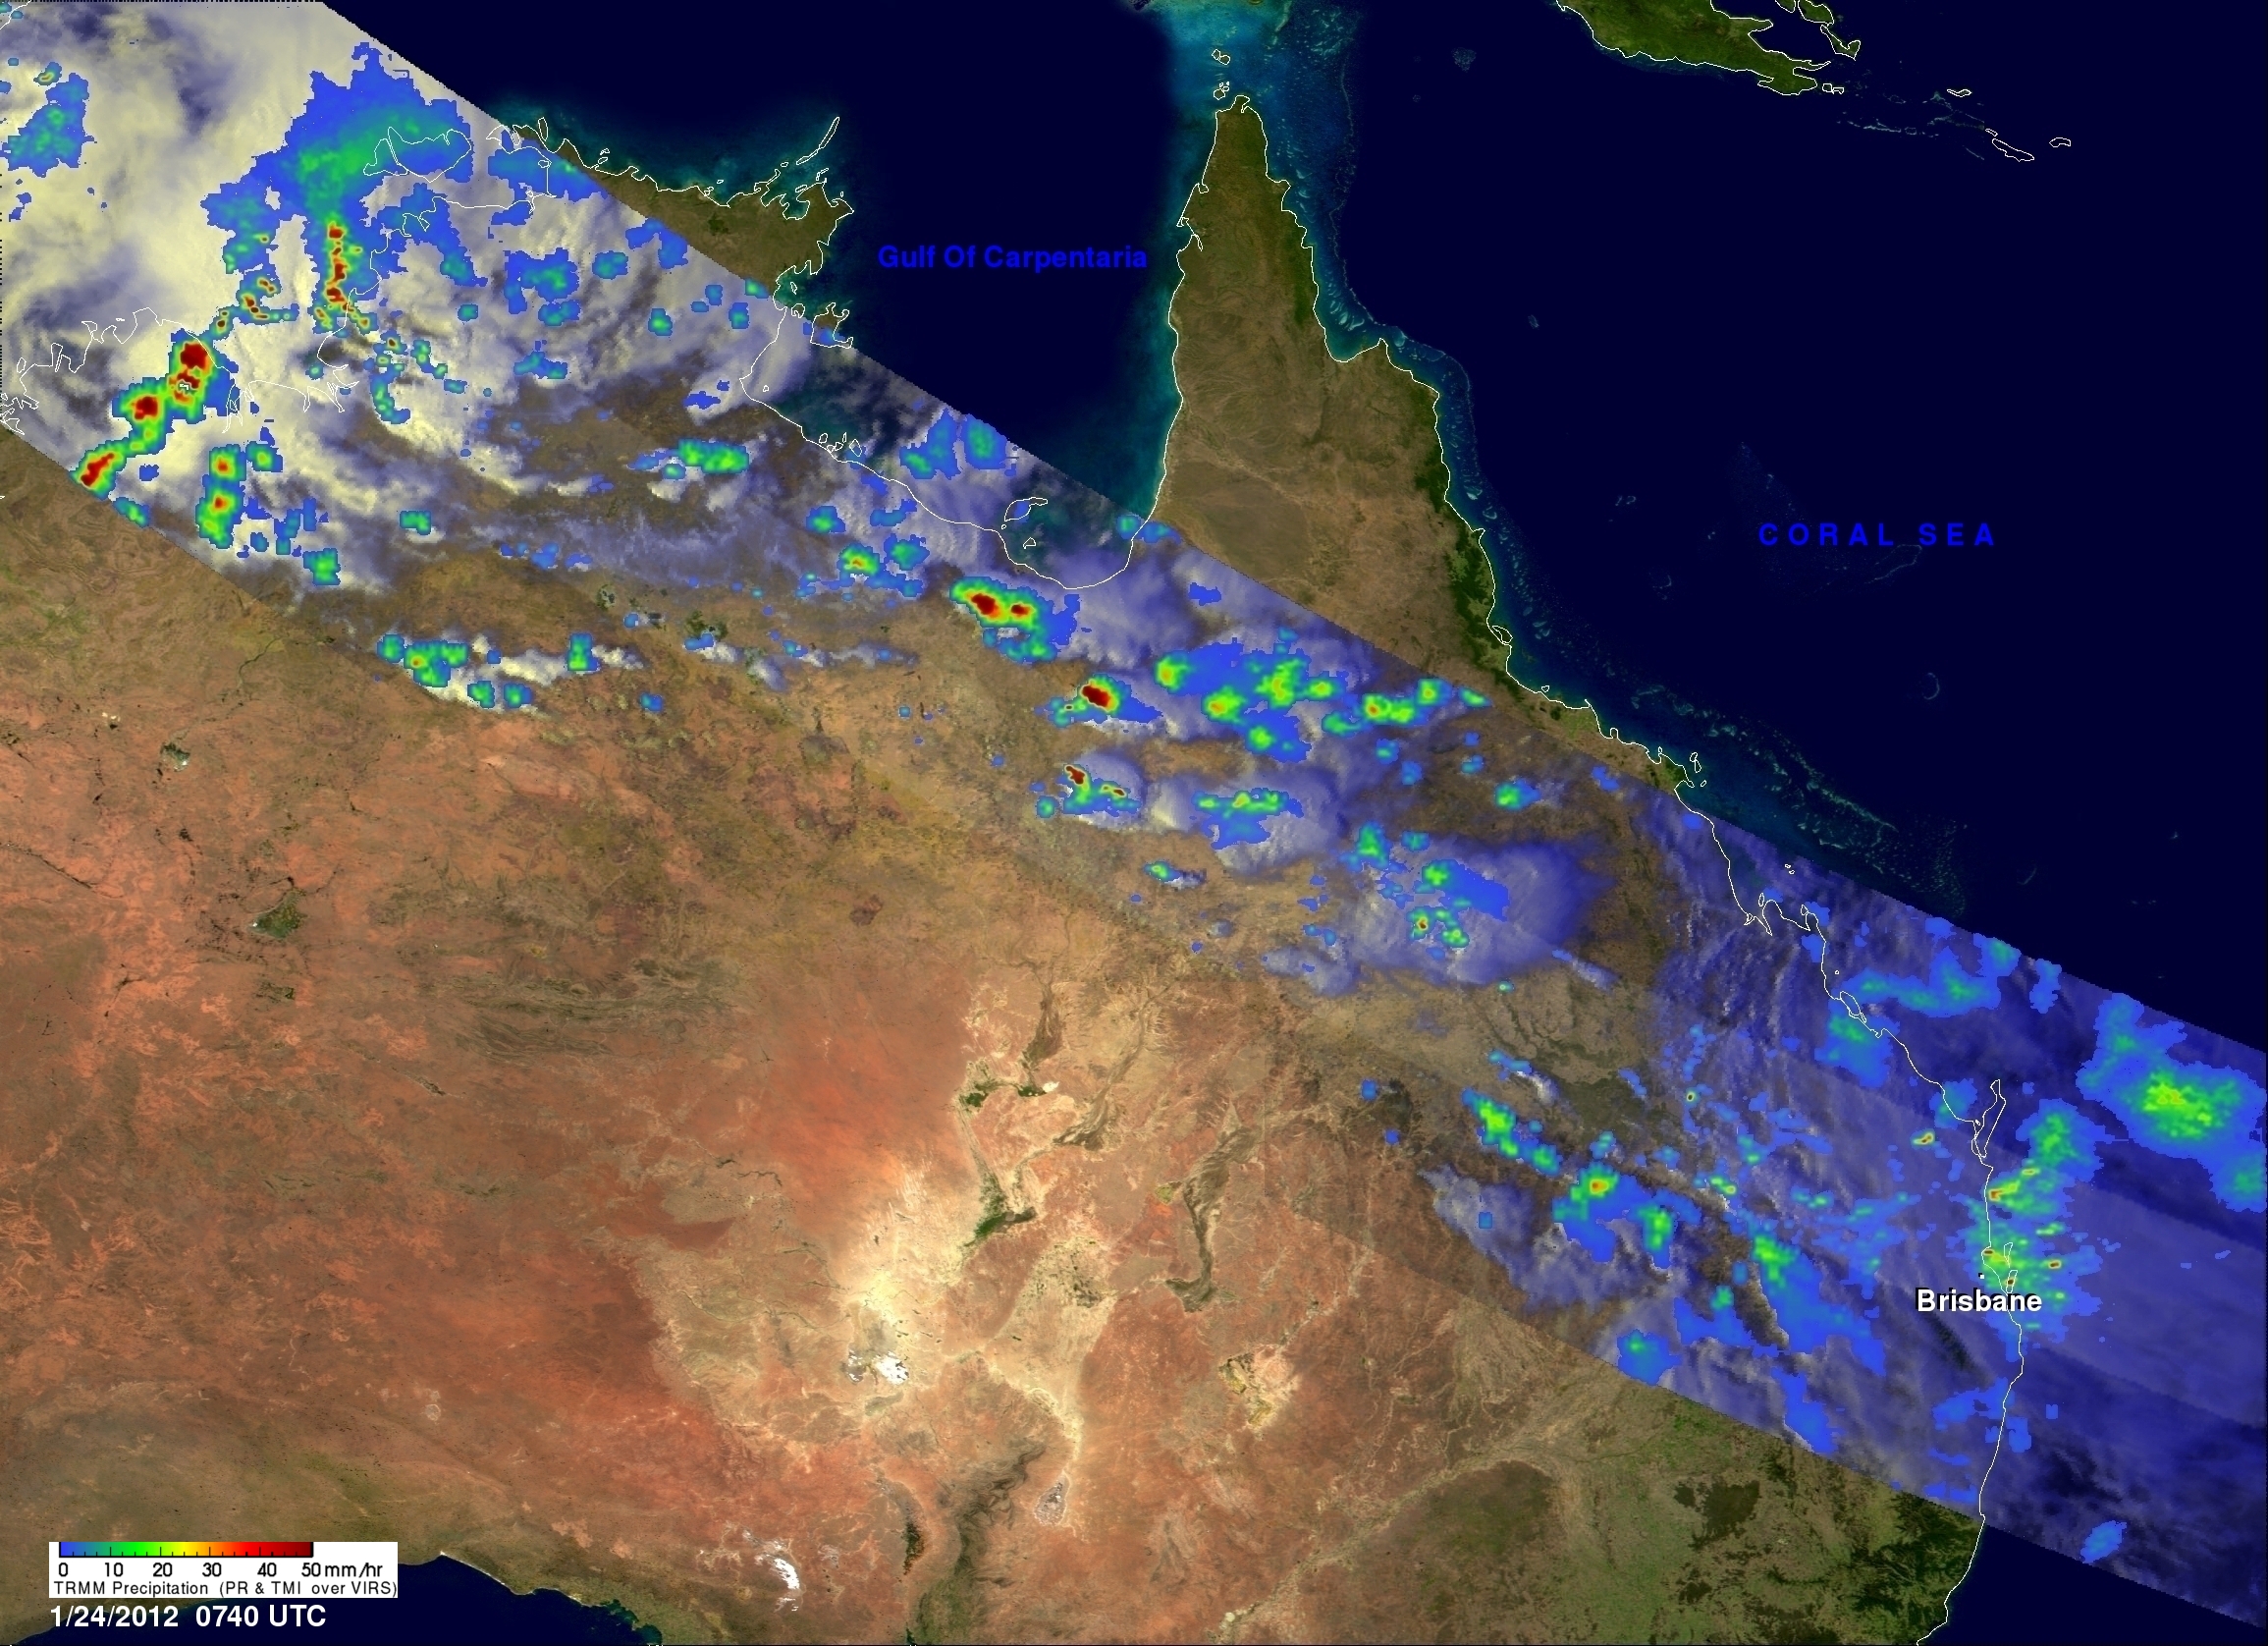
The image above uses data collected by TRMM at 07:49 UTC (5:59 pm Australian EST) 24 January 2012 and shows an instantaneous snap shot of the rain intensities across northern and eastern Australia associated with the monsoon. Rain rates in the center of the swath are from the TRMM Precipitation Radar (PR), while those in the outer portion are from the TRMM Microwave Imager (TMI). The rain rates are overlaid on visible data from the TRMM Visible Infrared Scanner (VIRS). TRMM gives an excellent perspective on just how broad the monsoon rains are with clusters of showers containing light to moderate to heavy rain (shown in blue, green, and red, respectively) stretching all the way from the northwest coast of the Northern Territory, across southern Queensland to beyond the coast of eastern Australia near Brisbane. At the time the image was taken, a monsoon trough stretched from the northwest coast of the Northern Territory southeastward through the center of Queensland and down into north- central New South Wales. At the northwest end of the trough, there was an area of low pressure, which is evident by the curvature in the rain features across the northern part of the Northern Territory.
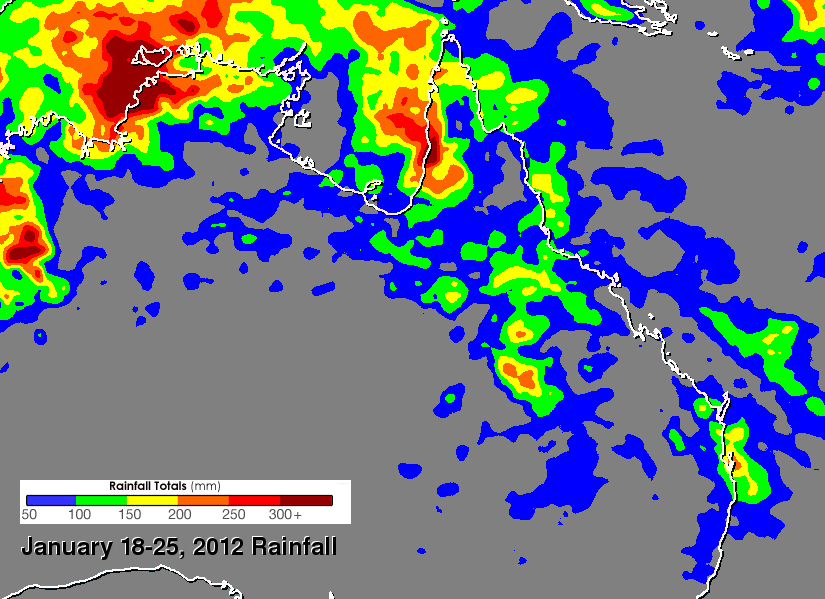
In addition to instantaneous rain, TRMM can provide estimates of rain accumulation. For increased coverage, TRMM can be used to calibrate rainfall estimates from other additional satellites. The TRMM-based, near-real time Multi-satellite Precipitation Analysis (TMPA) at the NASA Goddard Space Flight Center is used to monitor rainfall over the global Tropics. TMPA rainfall amounts are shown here for the week of 18 to 25 January 2012 for northeastern Australia and the surrounding region. The highest amounts appear along the northwest coasts of the Northern Territory and Queensland and are on the order of 300 mm (~12 inches, shown in brown). Lesser amounts on the order of 50 to 150 mm (~2 to 6 inches, shown in blue and green) extend across much of Queensland and along the coast near Brisbane with embedded areas of locally higher amounts. In addition to the monsoon trough, there is currently an active La Nina in the Pacific, which is characterized by above-normal sea surface temperatures in the West Pacific, below-normal sea surface temperatures in the East Pacific and stronger-than-average trade winds. La Nina typically brings wetter-than-average conditions to northern and eastern Australia.