
Tropical Storm Katia Takes Shape in the Atlantic
While parts of the East Coast and New England are still recovering from Hurricane Irene, a new storm is brewing in the Atlantic, Tropical Storm Katia. Katia began as an area of low pressure that had moved away from the coast of Africa south of the Cape Verde Islands in the central eastern Atlantic. This area of low pressure became the twelfth tropical depression of the season (TD #12) early on the morning of August 29th about 640 km (~400 miles) south-southwest of the Cape Verde Islands and about 1400 km (~870 miles) off the coast of Africa. Storms forming in this region are known as "Cape Verde" storms. They tend to be larger and stronger than average because of the open ocean and occur most often in August and September during the height of the hurricane season. Irene was a Cape Verde storm.
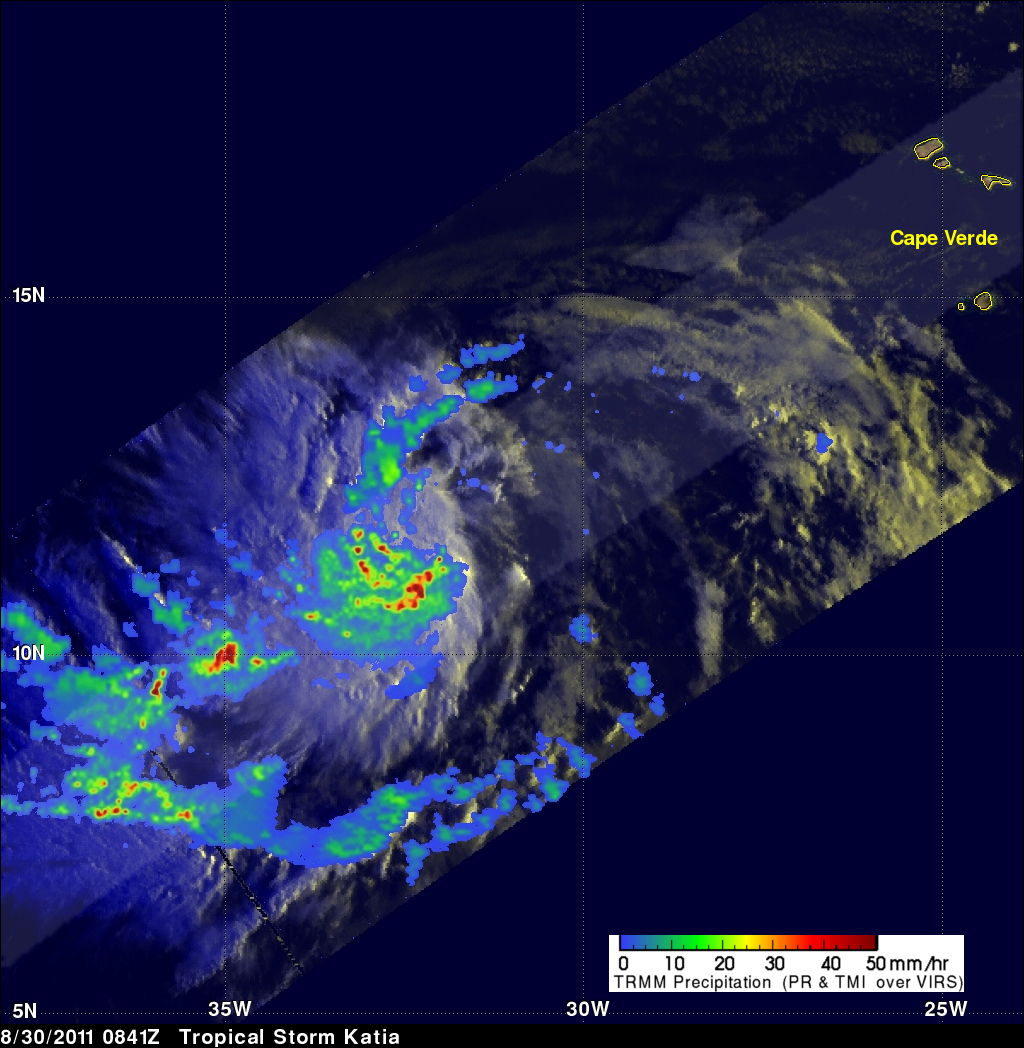
About a day after forming, TD #12 became a little better organized and was upgraded to a tropical storm and given the name Katia. Katia is new on the rotating list of names for tropical storms and hurricanes; it replaces the name Katrina, which was retired after the 2005 hurricane season. The Tropical Rainfall Measuring Mission satellite (or TRMM) flew over TD #12 and captured these images early on the morning of the 30th of August just before it was upgraded to a tropical storm. The images were taken at 8:41 UTC (4:41 am EDT) 30 August 2011 as TD #12 was moving west northwestward away from the Cape Verde Islands and into the central Atlantic. The first image shows the horizontal pattern of the rain intensity within the storm. Rain rates in the center swath are based on the TRMM Precipitation Radar (PR), and those in the outer swath on the TRMM Microwave Imager (TMI). The rain rates are overlaid on visible and infrared (IR) data from the TRMM Visible Infrared Scanner (VIRS). TRMM reveals a sizeable area of moderate rain (shown in green) with embedded areas of heavier rain (shown in red). Within this rain there is evidence of banding (curvature), revealing the presence of a cyclonic circulation. However, nearly all of the rain is located south and west of the estimated center. This is due in part to the system not yet being fully developed but also because it was feeling the effects of some northeasterly wind shear.

The second image was taken at the same time and shows a 3D image of the storm looking west courtesy of the TRMM PR. TRMM shows the presence of some deeper convective towers (shown in red), within the storm. Towers closest to the center of the storm (the nearest) reach about 12.5 km, while those in the outer rain band (farthest way) reach up to 15 km. These towers are associated with the areas of heavier rain in the previous image and can be a sign of future strengthening when located near the center as they indicate areas within the storm where heat is being released. Shortly after these images were taken, the system became a tropical storm with sustained winds estimated at 35 knots (~40 mph) by the National Hurricane Center (NHC). Katia is expected to continue on its current west-northwest track passing north of the Leeward Islands. It is also forecast to become a hurricane and possibly a major hurricane as it encounters warmer waters and reduced wind shear.
Click here to see TRMM's PR and TMI rainfall being drawn over a visible/infrared (VIRS) image.