
5 Years of Global Precipitation Measurement
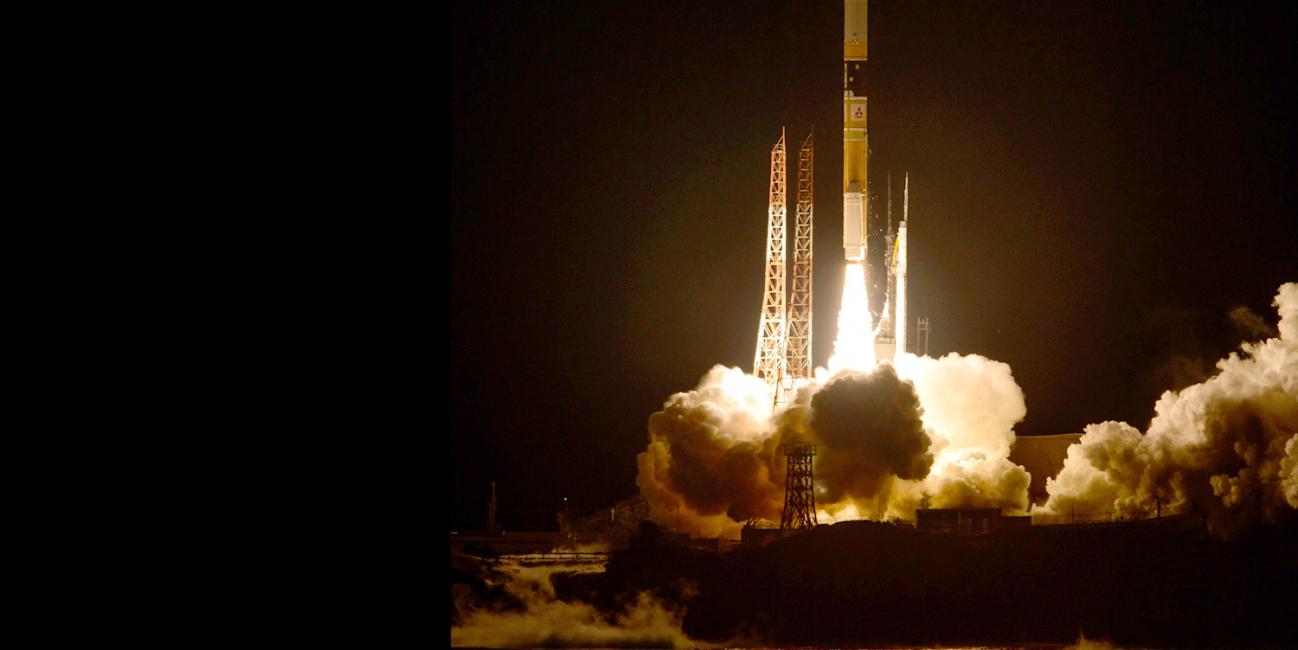
Five years ago, on Feb. 27, 2014, the Global Precipitation Measurement (GPM) Core Observatory, a joint satellite project by NASA and the Japan Aerospace Exploration Agency (JAXA), lifted off aboard a Japanese H-IIA rocket. Since then, the cutting-edge instruments on GPM have provided advanced measurements about the rain and snow particles within clouds, Earth’s precipitation patterns, extreme weather and myriad ways precipitation around the world affects society. Among the uses of GPM data are helping to forecast disease outbreaks in developing countries, producing global crop reports and identifying endangered Amazon river basins.
Unlike many NASA missions, which are research satellites with delayed data delivery, GPM was engineered to get data to scientists, operational and application users as soon as possible for societal benefits. It would help answer questions such as: Where is that hurricane? Will there be a flood? Should I water my crops?
GPM obtains data quickly using the Tracking and Data Relay Satellite (TDRS) 12-member satellite constellation, which serves as an information pipeline between Earth-orbiting satellites and NASA ground stations. On average, GPM can take 1 to 3 hours to get data into users’ hands, but in emergencies, the average delivery time can be pushed to between 15 and 90 minutes.
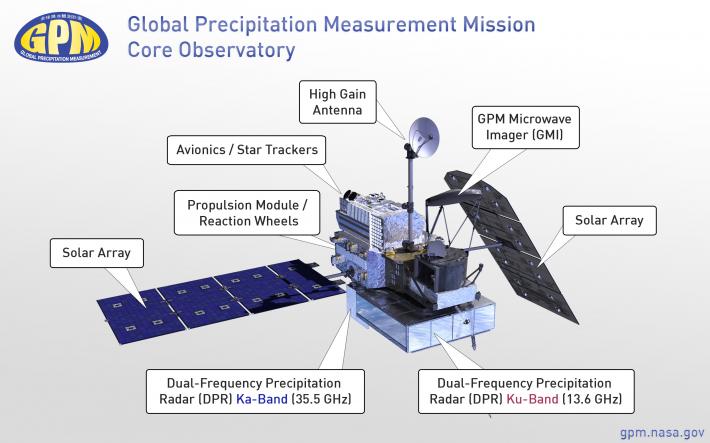
Diagram of the GPM Core Observatory
The mission’s main satellite, the Core Observatory, has two instruments: the Dual-frequency Precipitation Radar (DPR) and the GPM Microwave Imager (GMI).
JAXA manages the DPR, which uses two radar frequencies to measure precipitation in clouds, recording data about snow and rain particle sizes, shapes and rates. Using two radar bands, the DPR detects precipitation ranging from light to heavy, and yields a three-dimensional picture of where and how many raindrops, snowflakes or ice pellets of different sizes are distributed throughout a storm cloud.
The GMI, managed by NASA, uses 13 channels to measure microwave energy emitted within GMI’s field of view, including precipitation in the atmosphere. Like the DPR, the GMI can measure a range of precipitation types and severity. The low-frequency channels measure moderate-to-heavy precipitation, while the higher frequencies measure moderate-to-light precipitation.
The combination of the DPR and GMI gives scientists and meteorologists new insights into precipitation processes at both micro (particles within the clouds) and macro (regional to global) levels, making precipitation estimates and forecasts more accurate.
GPM’s main data source is the Core Observatory, but the mission receives data from the GPM Constellation, which consist of satellites with microwave sensors from the United States, Japan, India and Europe. Most of these satellites have unique objectives and oversight agencies, but by sharing their microwave data with GPM, they expand the mission’s global coverage and consistency.
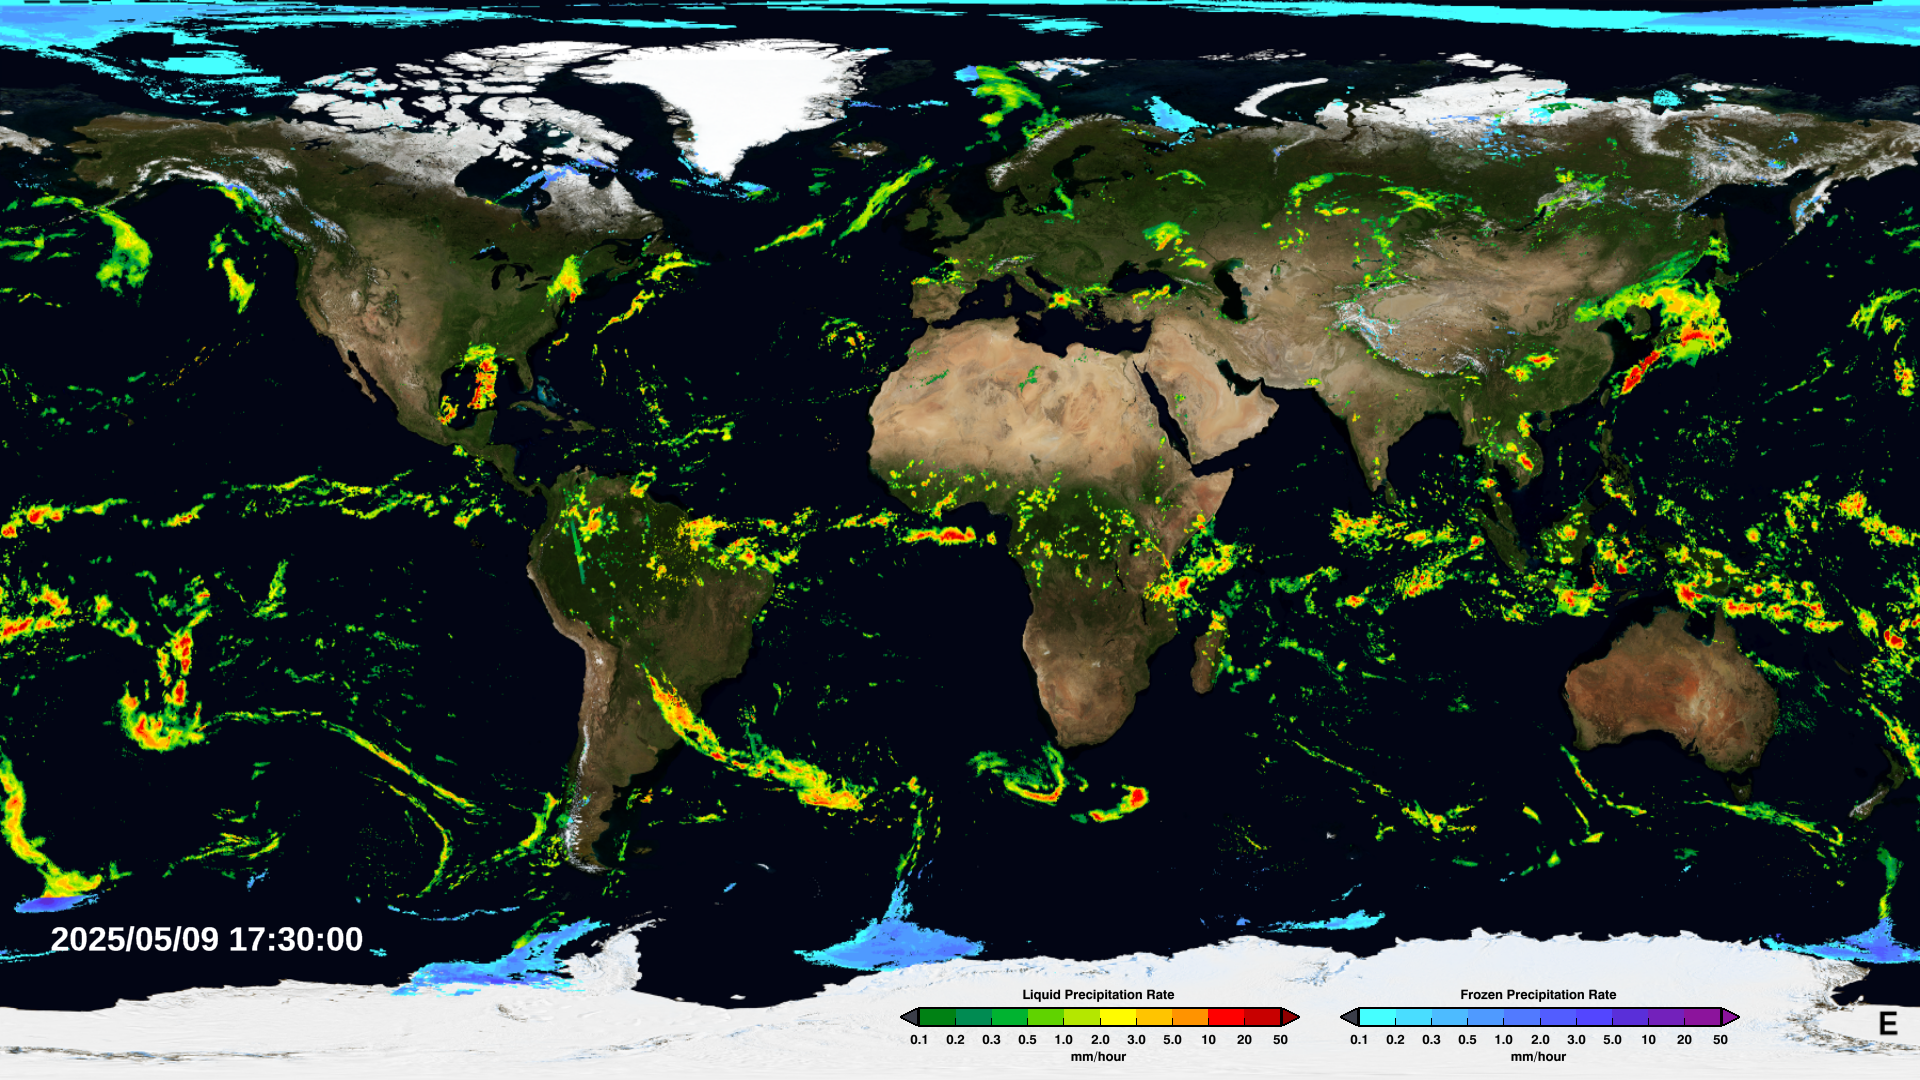 The latest IMERG global precipitation map.
The satellites’ data are combined with ground data to create the final product, the Integrated Multi-satellitE Retrievals for GPM (IMERG), which is used for predicting weather, building climate models, managing water resources and forecasting extreme weather. While the full IMERG data product takes time to clean up and prepare, a near-real-time visualization of current global precipitation is available every 30 minutes at regional scales (10 km by 10 km/6.2 x 6.2 miles).
GPM’s ground validation system provides a yardstick against which to measure the quality of its satellite-based data. Rather than relying on satellite data alone to measure precipitation and develop forecasts, the GPM team compares space-based data with information collected by ground-based radar from the National Oceanic and Atmospheric Administration (NOAA), traditional rain gauges, and disdrometers, or drop size measuring tools. When the ground and space data disagree, the team investigates the differences and makes updates to the algorithm to make future data collection more accurate.
With GPM’s accurate estimates of where, when, and how precipitation falls around the world, scientists gain knowledge of the inner workings of rain clouds that improves weather and climate forecasts.
For the first time in 360 degrees, this data visualization takes you inside Hurricane Maria. Click and drag within the video to look around.
Credits: NASA's Goddard Space Flight Center
Download this video and supporting visuals from the Scientific Visualization Studio
In 2017, data visualizers and scientists worked together to create one of the first 3D models of a hurricane that mapped not only precipitation amounts, but also particle sizes and types. GPM data also plays a key role in building disaster prediction models, like the Landslide Hazard Assessment model for Situational Awareness (LHASA), which warns about imminent landslides based on heavy rainfall data. GPM helps inform everyday decisions -- Do I need to evacuate? – and long-term planning -- How are precipitation patterns changing in a warming climate?
GPM has advanced scientists’ understanding of Earth’s water and energy cycles in its first five years, and it is just getting started. The mission is expected to last into the mid-2030’s. If this forecast is correct, GPM continue raining down valuable data for many years to come.
For more information about NASA's Precipitation Measurement Missions, visit:
https://pmm.nasa.gov/science/precipitation-algorithms
For more information about NASA-JAXA's GPM, visit:
www.nasa.gov/gpm.