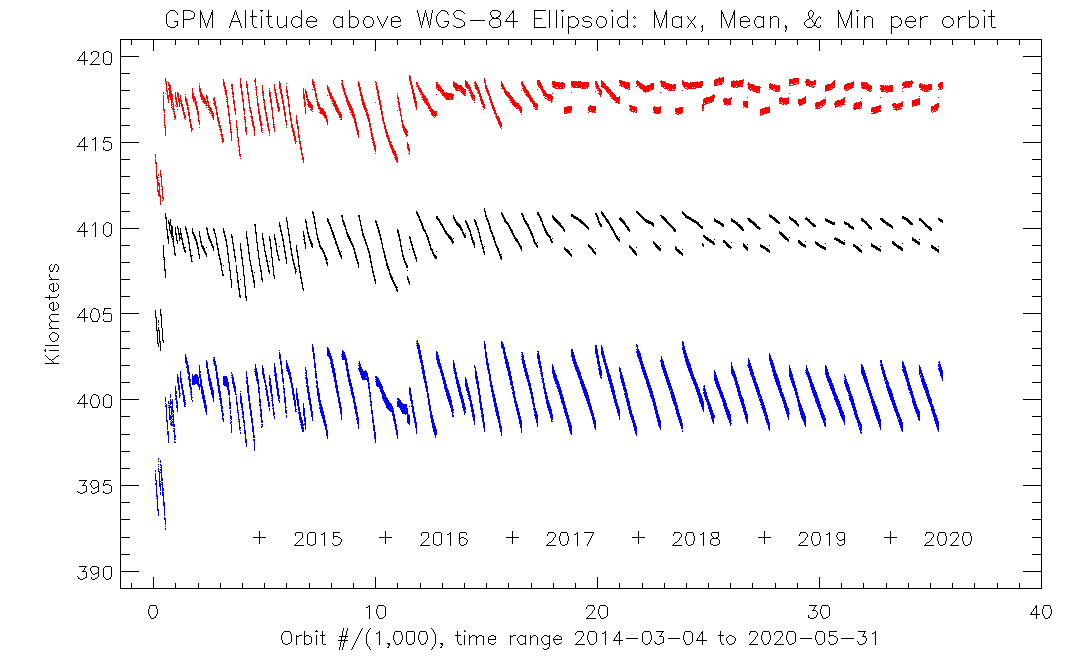
This graph shows the maximum (red), mean (black), and minimum (blue) altitude of the GPM Core Observatory satellite, by orbit number, from 3/4/2014 to 5/31/2020. Credit: Steve Bilanow, NASA Precipitation Processing System
Learn more about the GPM Core Observatory satellite