
Top 5 GPM Applications Highlights
![]()
For the past 5 years GPM data has provided critical information to end-users to further our understanding of Earth's water cycle and to facilitate decision‐making at local and global scales. Building on the legacy of TRMM, the use of high‐quality precipitation data provided by GPM, with global coverage, has enabled new science research and data applications to benefit society across a diverse range of applications including water resource and ecological management, operational numerical weather prediction, disease prediction, and disaster modeling and response.
Here are five highlights of the many applications of GPM data used for decision-making.
Driving Hydropower Generation in Indonesia using GPM IMERG
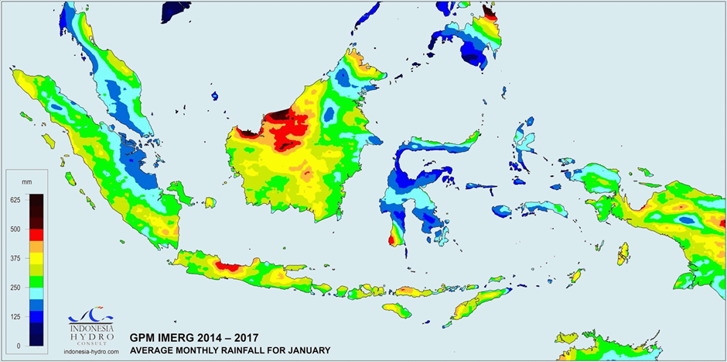
Average annual rainfall in Indonesia for January, 2014 – 2017, GPM IMERG (INDONESIA HYDRO™ CONSULT)
Availability of river flow is an important factor in the planning and the development of a hydropower plant to estimate its capacity and energy production. A hydro engineering consulting service company in Indonesia, INDONESIA HYDRO™ CONSULT, is using NASA’s TRMM and GPM precipitation data to better understand the potential for hydropower projects throughout Indonesia. These data are particularly relevant where rivers are either ungauged or the quality of records from the gauging stations are unreliable. This company provides hydrological modeling consulting services for hydro developers, leveraging satellite precipitation data along with river discharge, slope, vegetation, and evapotranspiration to characterize potential opportunities for hydropower plant construction.
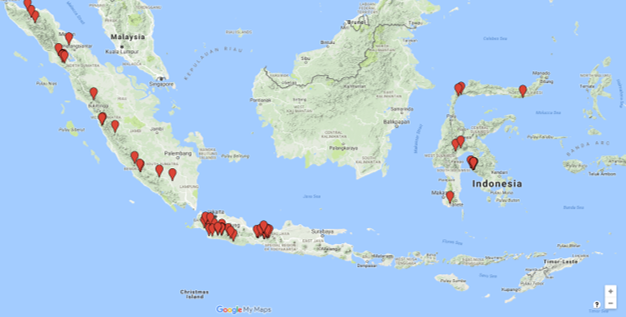
INDONESIA HYDRO™ CONSULT project locations throughout Indonesia
Identifying Endangered River Basins in the Amazon using GPM
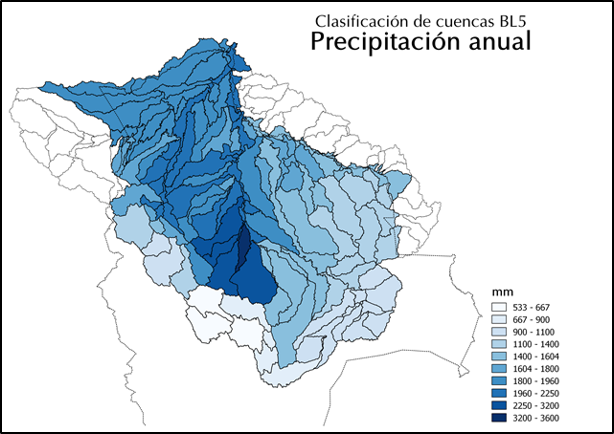 Annual precipitation rate in the Amazon basin.
The large-scale development of agriculture, mining, oil & gas, hydroelectric dams, timber and fisheries in the Amazon have set the stage for large-scale environmental research, planning and management of aquatic ecosystems. To address this issue, the Wildlife Conservation Society (WCS) in Bolivia are using over 17 years of precipitation data (1998-2015) from NASA’s Tropical Rainfall Measuring Mission (TRMM) and Global Precipitation Measurement Mission (GPM) to collect rainfall totals and estimate potential discharge rates throughout the Bolivian Amazon.
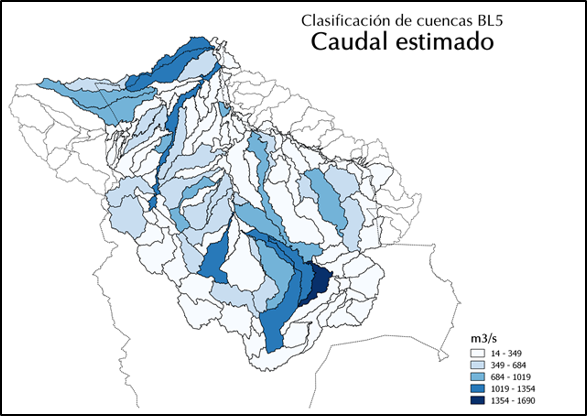 Estimated Discharge rate in the Amazon basin.
This information will enable WCS Bolivia to identify endangered river basins, which will then provide decision makers a useful framework to implement a mitigation hierarchy approach. This approach will be a useful guide to limit negative impacts on biodiversity such as dam implementation in Bolivia.
Predicting Cholera in Yemen using NASA Satellites
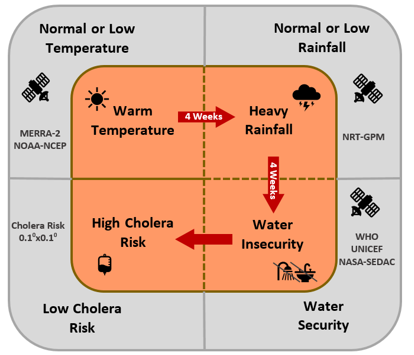
Flow chart to determine areas at high cholera risk using satellite data
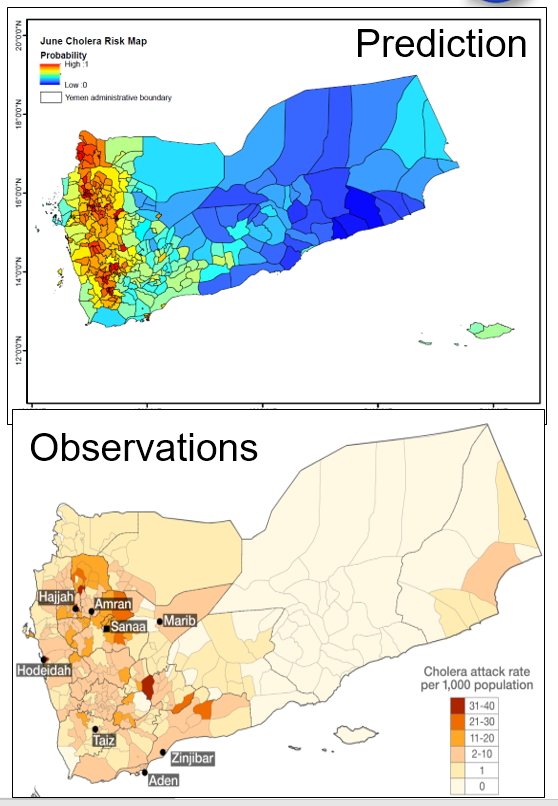
Real-time cholera risk prediction map for Yemen in June 2017 (top). Areas in red have the highest risk of cholera outbreak. In-country records that a cholera epidemic occurred in June 2017 (bottom). Content and image credits: Antar Jutla, West Virginia University, & Rita Colwell, University of Maryland
Cholera, a waterborne bacterial disease, infects millions of people each year, leading to thousands of deaths. Predicting favorable conditions for cholera infection relies on identifying areas of above average temperatures and rainfall, poor water infrastructures and changes in land use. To tackle this problem, scientists are monitoring regional hydroclimatic processes and changes in the aquatic ecosystem with NASA satellite data, including precipitation from TRMM and GPM and air temperature from MERRIS to develop forecasts for the risk of a cholera outbreaks across developing countries such as Yemen, Haiti, South Africa and Bangladesh. These data, along with data from other sensors and socioeconomic data, are used to assess the areas most at risk of cholera. Project findings are being used to map unsafe water sources, prepare warnings related to water quality, and predict the potential of disease outbreaks.
Monitoring California’s Carr Fire with the Support of GPM
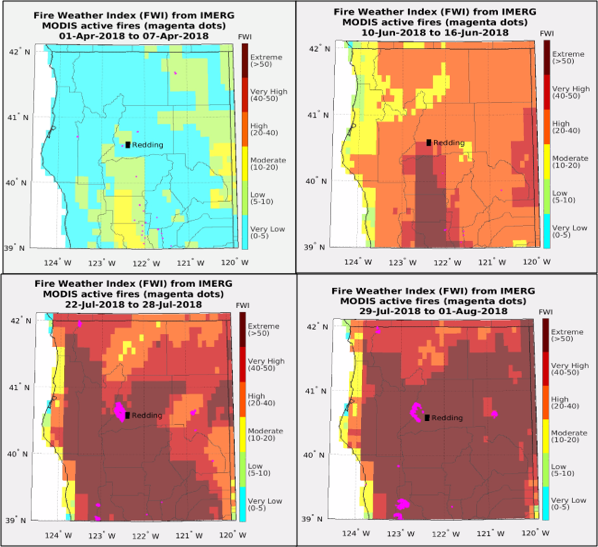
Figures 1-4: Evolution of weekly FWI and MODIS active fires over northern California from April 1 to August 1, 2018. Low FWI in April, then FWI increased in June, and was consistently at Very High or Extreme levels through July. FWI is computed using local 12:00pm surface temperature, relative humidity and wind speed from NASA GMAO’s GEOS-5 model, and daily IMERG precipitation estimates.
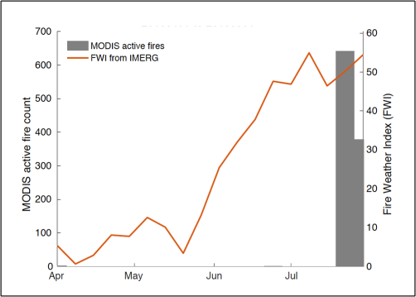
Weekly FWI and MODIS active fire totals over the Carr fire region from April through July, 2018.
The Carr Fire in Northern California erupted on July 23, 2018 and covered over 195 miles (~127,000 acres) by August 2. Hot, dry and windy conditions combined with an extraordinarily high fuel load in the area have transformed the low, local burn into an expansive blaze. More than 4,300 fire personnel have been assigned to the blaze. To help understand and monitor areas for fire danger such as the Carr Fire, NASA’s Global Fire WEather Database (GFWED) is used which integrates different weather factors, including daily GPM IMERG precipitation estimates, influencing the likelihood of a vegetation fire starting and spreading. GFWED provides a globally consistent fire weather dataset for fire researchers and managers to apply locally. Data are available via the Global Fire Weather Database: https://data.giss.nasa.gov/impacts/gfwed/.
Using GPM for Global Crop Production Analysis
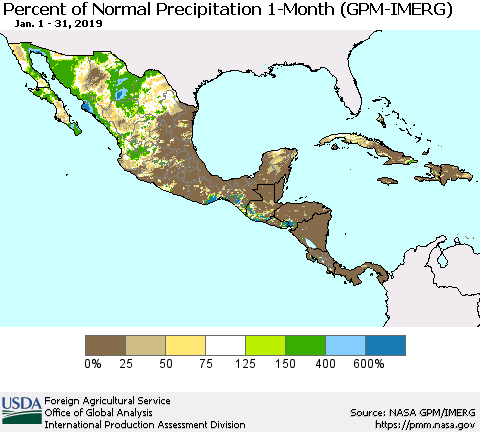
GPM IMERG percent of normal precipitation for Feb 5 - 11, 2018.
NASA’s precipitation products have been incorporated into USDA Foreign Agricultural Service’s global crop production analysis to determine impacts on agricultural yields and vegetation health. Due to high resolution of the data, GPM IMERG data is used as a precipitation reference data source to develop weekly, 10-day, monthly, and 3-month precipitation data sets at USDA/FAS/IPAD.
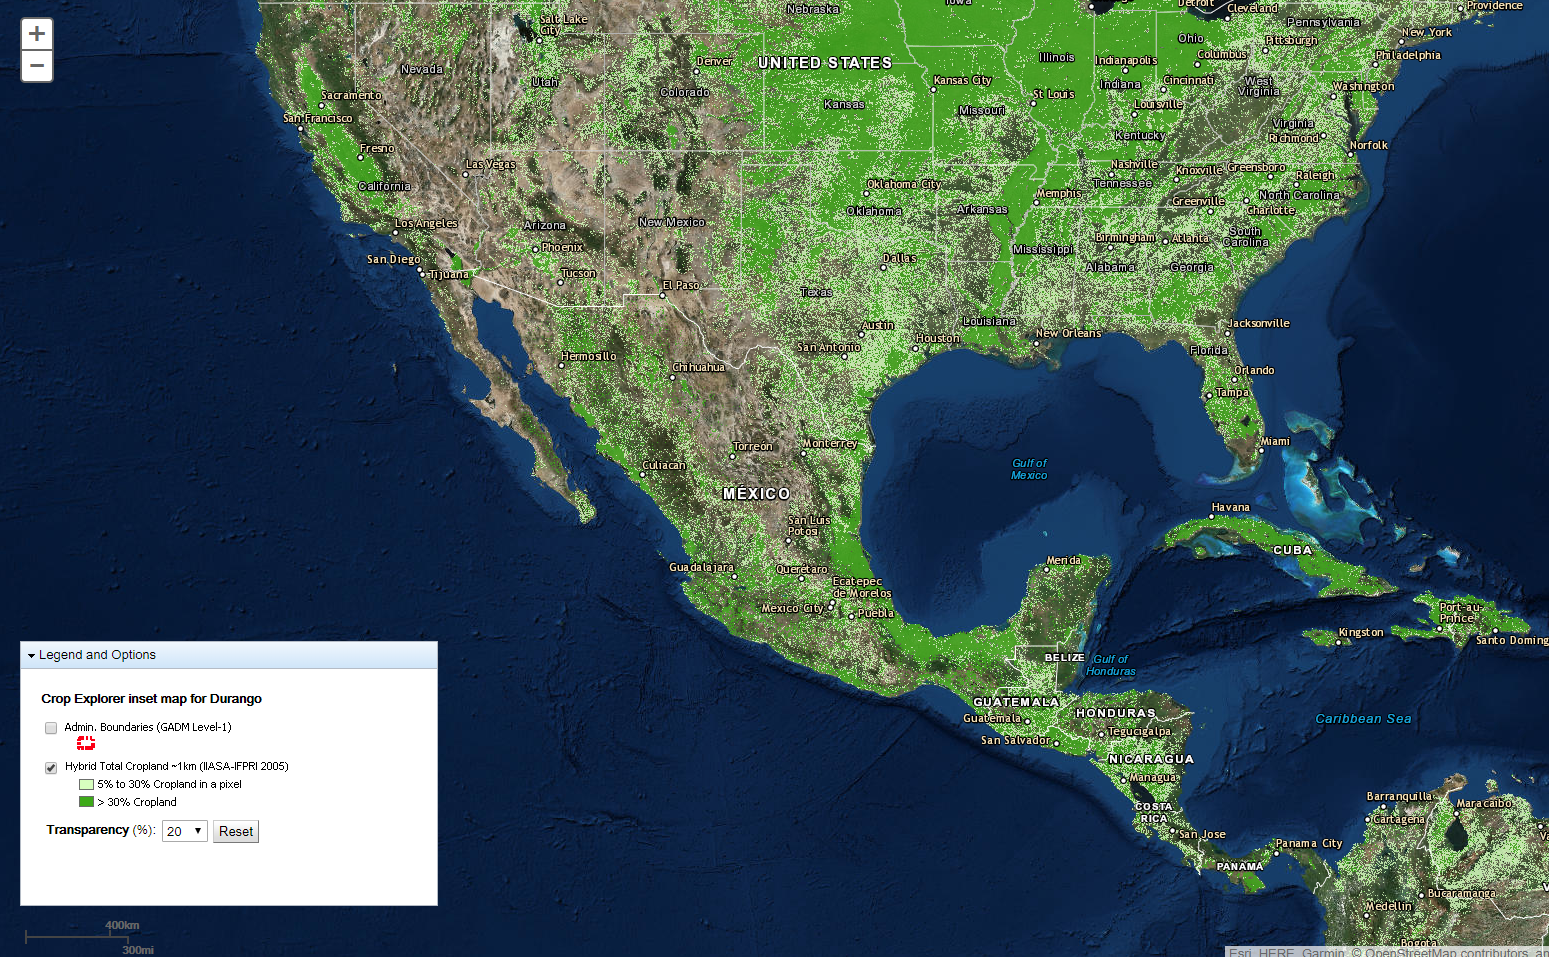
Google Crop Explorer from USDA/FAS IPAD
The International Production Assessment Division (IPAD) of FAS provides global agricultural production outlook and the conditions affecting food security. IPAD assessments are an integral component of the monthly crop assessments issued by USDA's World Agricultural Outlook Board - a primary source for agricultural information worldwide (USDA FAS).