
Exploring Precipitation's Impact on the 2019 and 2020 Alaska Wildfires
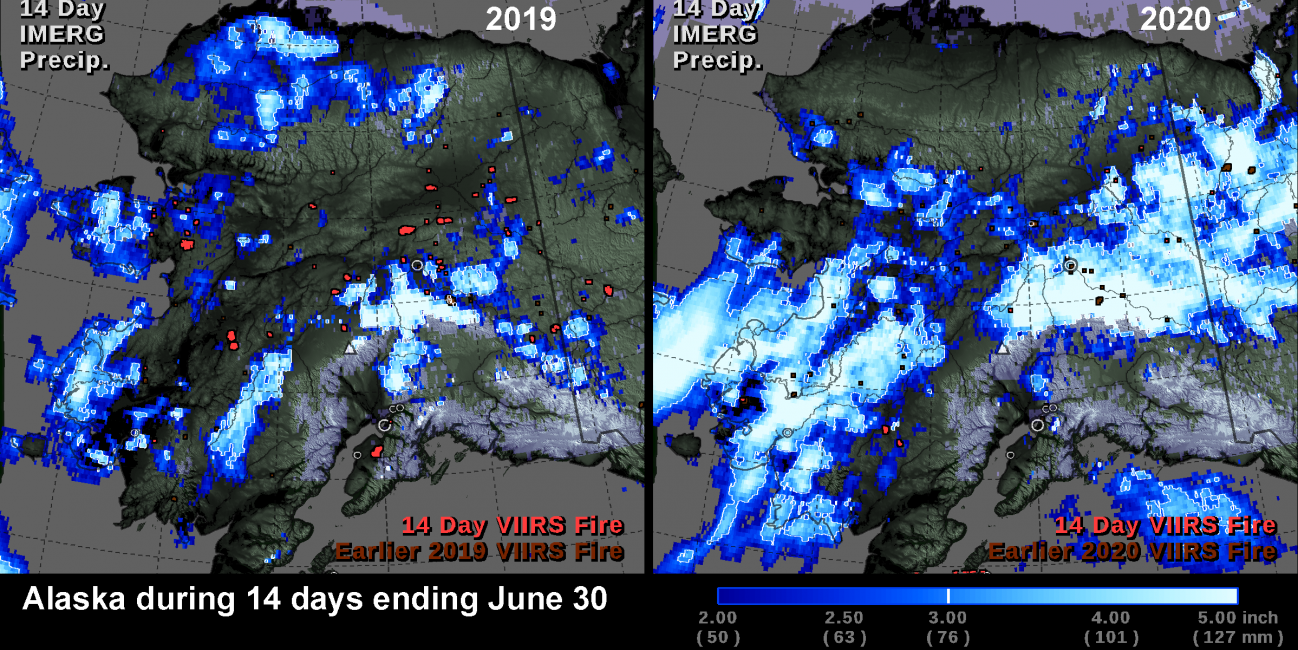
NASA's multi-satellite precipitation algorithm, known as IMERG, is a tool that can help us understand recent fluctuations in Alaska's wildfires. In the summer of 2020, wildfires burned fewer acres in Alaska than in any other year during the past 10 years. In contrast, wildfires burned a record number of acres in Alaska in the summer of 2019. The image below shows the locations of satellite-detected fires and precipitation during the last two weeks of June for both years.

The above image shows IMERG rainfall totals overlaid with fire hot spot detections from the Visible Infrared Imaging Radiometer Suite (VIIRS) instrument aboard the NASA/NOAA Suomi-NPP satellite. As shown in the left half of the image, a large area of Alaska's interior received very low rain accumulation (less than 2 inches) during the last two weeks of June 2019. This area also experienced a large number of wildfires. The right half of the image shows that, in 2020, there was significant rain accumulation in this portion of Alaska and essentially no wildfires during the same two-week period. This image shows only part of the summer. One way to see the entire season is to calculate a time series, such as the ones shown below.
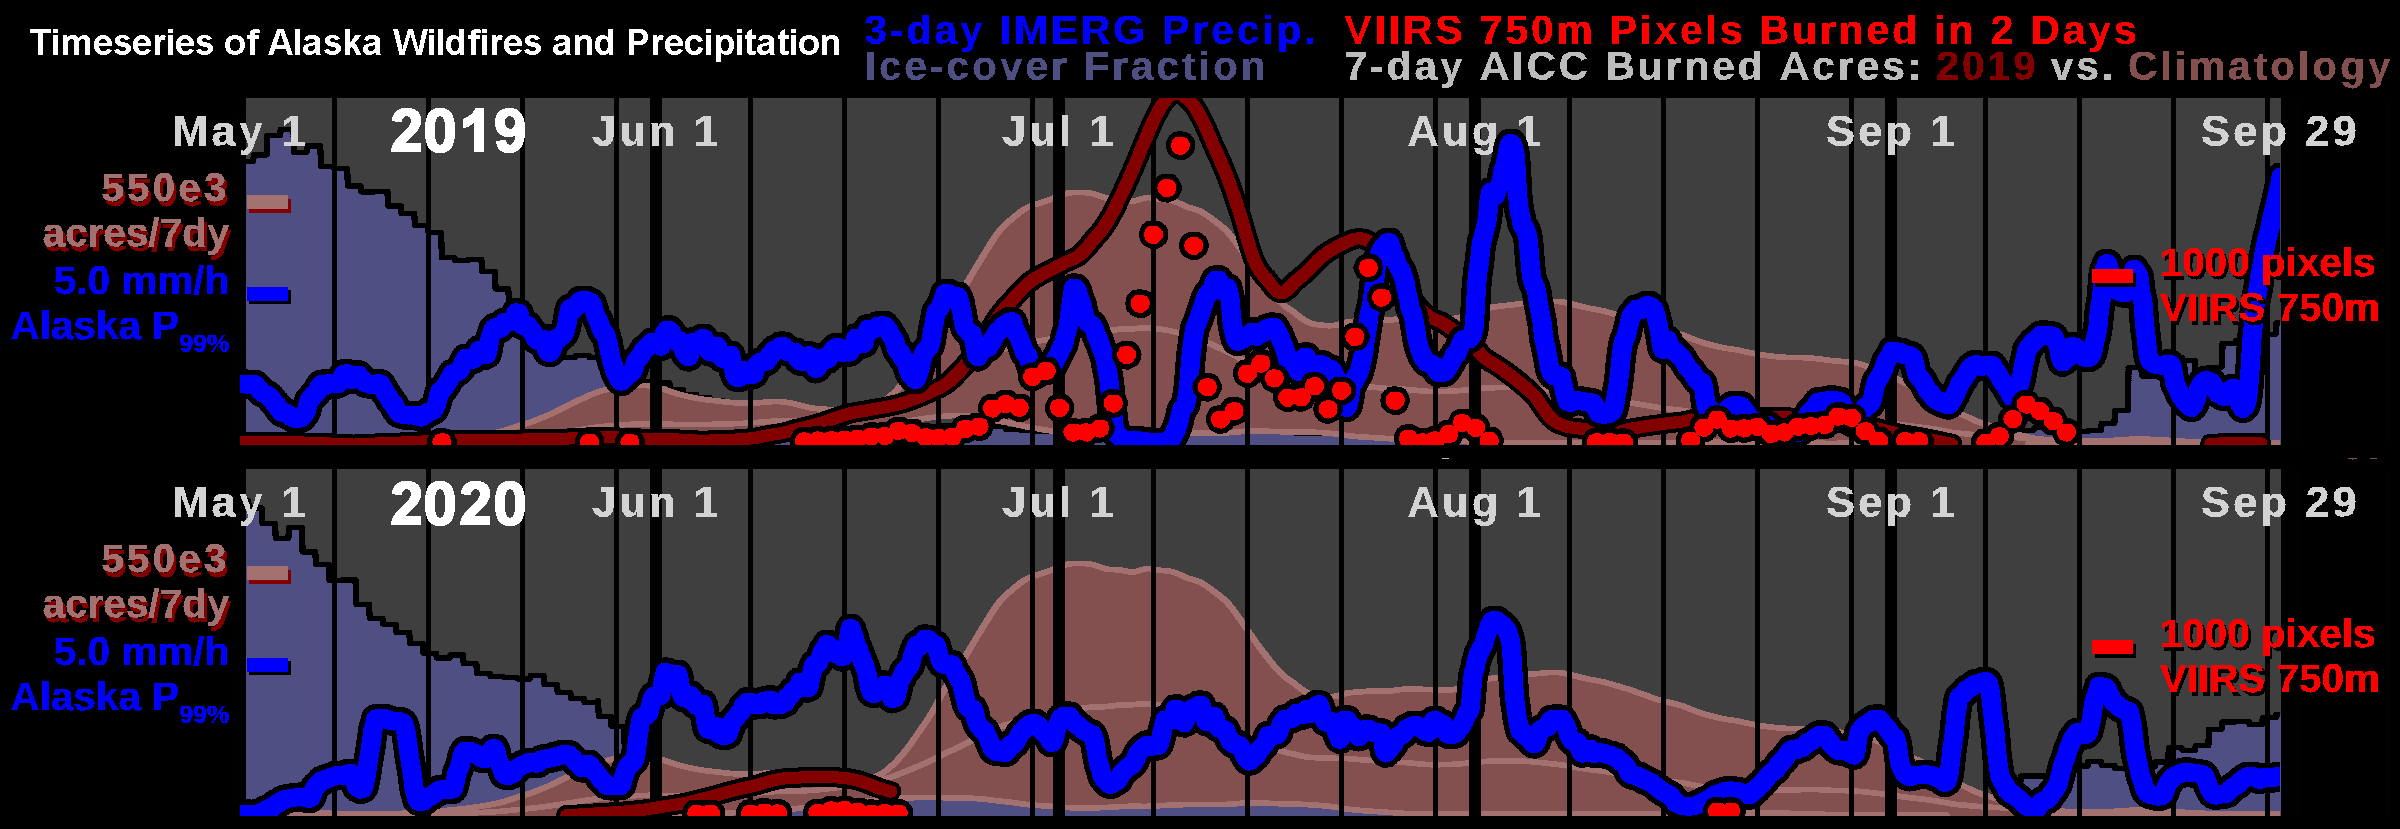
For the summers of 2019 and 2020, these two time series show wildfire estimates for the current year as well as climatological information about the Alaska wildfire season.
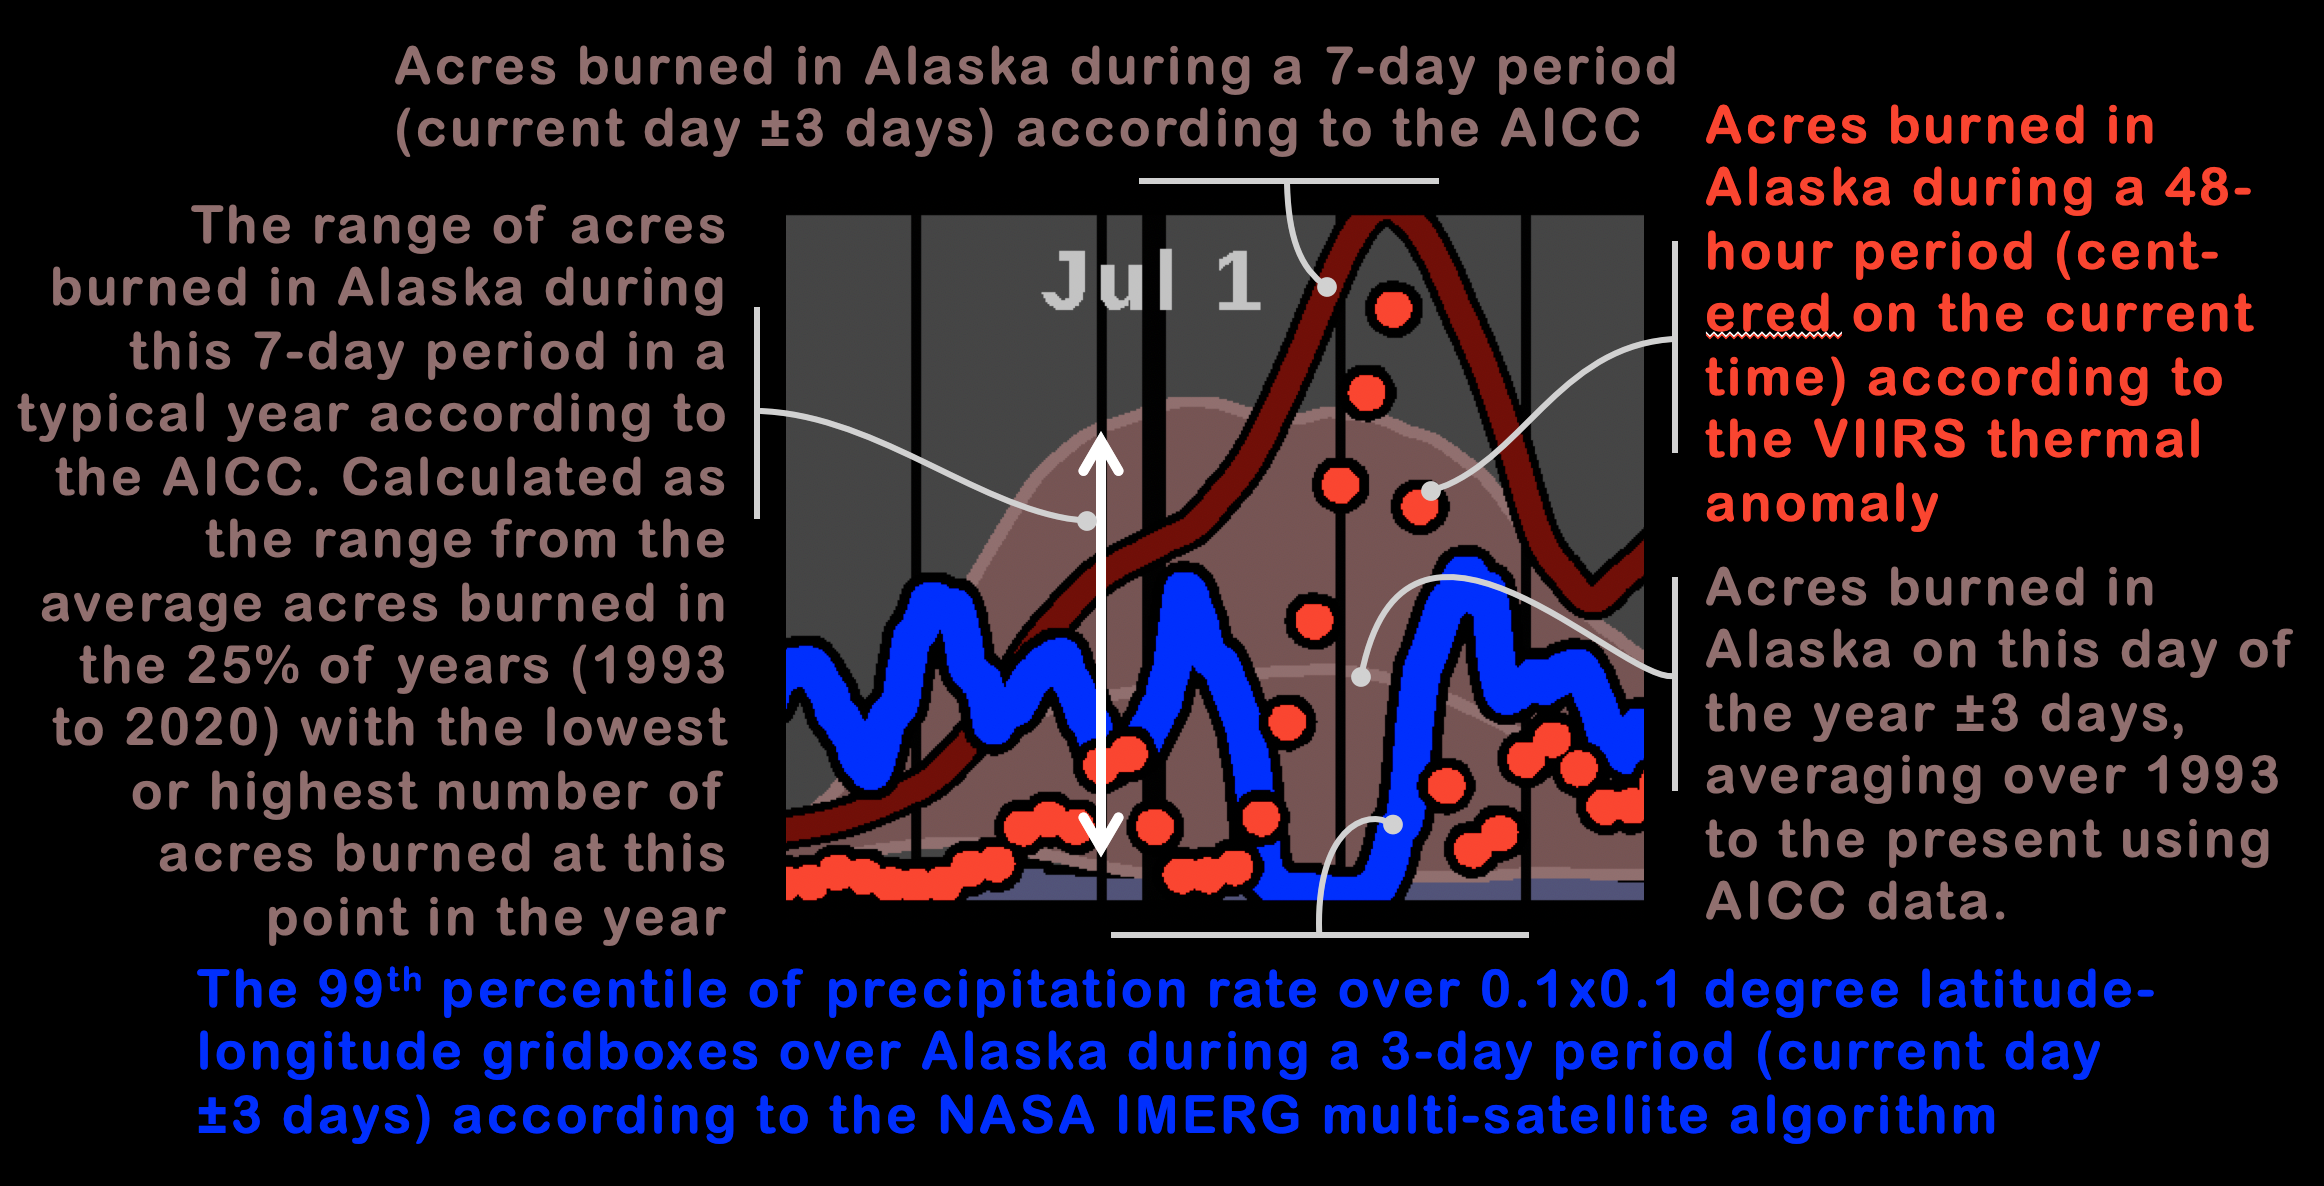
The dark red line in the time series shows the Alaska Interagency Coordination Center (AICC) estimates of acres burned during a 7-day period (https://fire.ak.blm.gov/). The faded gray-red area is also AICC data, but it shows the range of acres burned in a typical year, based on the daily statistics from 1993 to present (view data). The upper bound of the gray-red area is the average number of acres burned in the 25% of years with the most acres burned. The lower bound of the gray-red area is the average value in the 25% of years with the least acres burned. The line that runs approximately through the middle of the gray-red area is the number of acres burned at this day of year averaging all years 1993 to present. Plotted in bright red is an independent measure of wildfires activity, specifically, the thermal anomalies detected by VIIRS. The plotted value is the number of VIIRS 750-meter pixels exhibiting a thermal anomaly during a 2-day period.
The times series shows in blue the heaviest rain falling in Alaska, represented by the 99th percentile of IMERG-estimated precipitation rates over Alaska, averaged over a 3-day period. The precipitation estimate is calculated from IMERG's 0.1 x 0.1 degree latitude-longitude grid boxes, with data updated every 30 minutes. As spring moves to summer the fraction of Alaska covered by snow or ice shrinks, as indicated in the time series by the dark blue area. Snow and ice cover from the NOAA global multi-sensor automated snow/ice map is referred to as "Autosnow". Version 6 of the IMERG algorithm can estimate precipitation only where it falls on ground that is free of ice and snow. This limitation of the IMERG algorithm is not relevant to monitoring the peak of the wildfires season because wildfires are unlikely where the ground is snow or ice-covered.
One of the important features shown in these time series is the drop to almost no precipitation during the first week of July, 2019, which is near the climatological peak of Alaska's fire season. That lack of rain led to a deep layer of fuel drying out and a large number of acres burning. Lightning from earlier storms ignited most of the fires that grew and persisted during the rain-free period. Approximately 2.5 million acres burned in Alaska during the summer of 2019, which was above average, but less than the all-time record of 6.6 million acres that burned in Alaska during the summer of 2004.
Compared with 2019, Alaska saw more rain during June 2020, and the rain persisted into July. 2020's rain was sufficient to dampen a deep layer of the forest floor, so fires had trouble spreading along the surface or underground. Compared to recent years, very few acres were burned by wildfire in Alaska in 2020 - about 180,000 acres. The 2020 acreage was below average, but more than the 1993 to 2020 minimum, which was 44,000 acres in 1995.
The above analysis is further illustrated by the below "time-lapse" animations, with fires appearing and disappearing and storms systems flowing across the state as the summer progresses. These animations show long-term data on the left and short-term data on the right. The left panel shows Alaska's 14-day precipitation accumulation, while the right panel shows precipitation accumulation during a 3-hour period.
In these animations the faded gray-blue area is the sea and land area that are covered by snow or ice according to the NOAA Autosnow data product. The map shows precipitation in shades of bright, saturated blue. Wildfire locations are shown in bright red based on the VIIRS 750-meter thermal anomaly data. The locations of earlier VIIRS-detected wildfires are shown in brown-red. The map depicts the location of selected major cities as open circles. The triangle indicates Denali, North America's tallest mountain (formerly known as Mount McKinley).
Wildfires can impact a large area, and vary considerably from year to year. Temperature, fuel supply, and lightning frequency also influence the number of acres burned in any given year. Timely and accurate estimates of precipitation, combined with other Earth observing datasets, can improve the prediction and monitoring of wildfires.
Credits:
Visualization and text by Owen Kelley (NASA GSFC).