
GPM Tracks Typhoon Surigae in the West Pacific
Although it was only the 2nd named storm of the 2021 Pacific typhoon season, Typhoon Surigae became not only the first super typhoon of the season, but also the strongest tropical cyclone of 2021 worldwide. The majority of storms in the Northwest Pacific region form between June and Nov., but the season runs yearlong, as storms can form in any month in this region, which stretches from 100 degrees East to 180 degrees East, north of the equator.
Surigae originated from an area of low pressure about 700 miles south of Guam. Persistent thunderstorm activity resulted in the formation of a tropical depression on April 12. The next day, after further organizing, the system was upgraded to a tropical storm by the Japan Meteorological Agency (JMA) and given the name Surigae. The US Joint Typhoon Warning Center (JTWC) likewise upgraded the system to a tropical storm early on the 14th. During this time, the system moved northwest over the West Pacific slowly but steadily in the general direction of Palau.
Download this video in high resolution from the NASA Goddard Scientific Visualization Studio
With its array of active and passive sensors, the NASA / JAXA GPM Core Observatory satellite is ideal for monitoring and studying tropical cyclones. This animation of GPM data follows Surigae’s progress through the West Pacific beginning on April 14, 2021, as it made its way towards Palau. The animation first shows a time loop of half-hourly surface rainfall estimates from NASA’s IMERG precipitation product overlaid on IR data from the Himawari-8 satellite. IMERG shows that the Pacific is rather active at this time with widespread rain activity stretching from the Philippines south towards Indonesia and eastward towards the Dateline. Surigae is embedded within the northern part and is the most prominent feature withing this widespread area of rain activity. IMERG shows a large area of moderate to heavy rain (shown in yellow and red, respectively) in association with Surigae. Most of this rain is located west and south of the center. This asymmetric structure indicates that Surigae’s circulation was not yet very intense. However, periodic episodes of intense rainfall (shown in magenta), reveal areas of more intense thunderstorm activity, which results in large bursts of heat being released into the storm’s circulation and can be a precursor to future intensification. This is known as latent heating and comes mainly from condensation. It is the primary driver of a tropical cyclone’s circulation. During this period Surigae continued to slowly intensify and was declared a severe tropical storm by JMA with maximum sustained winds estimated at 50 knots (~58 mph) at 0000 UTC on the 15th just as the system was about to pass north of Palau. Soon after, the GPM Core satellite overflew Surigae at around 02:30 UTC on the 15th, providing a detailed look into the storm.
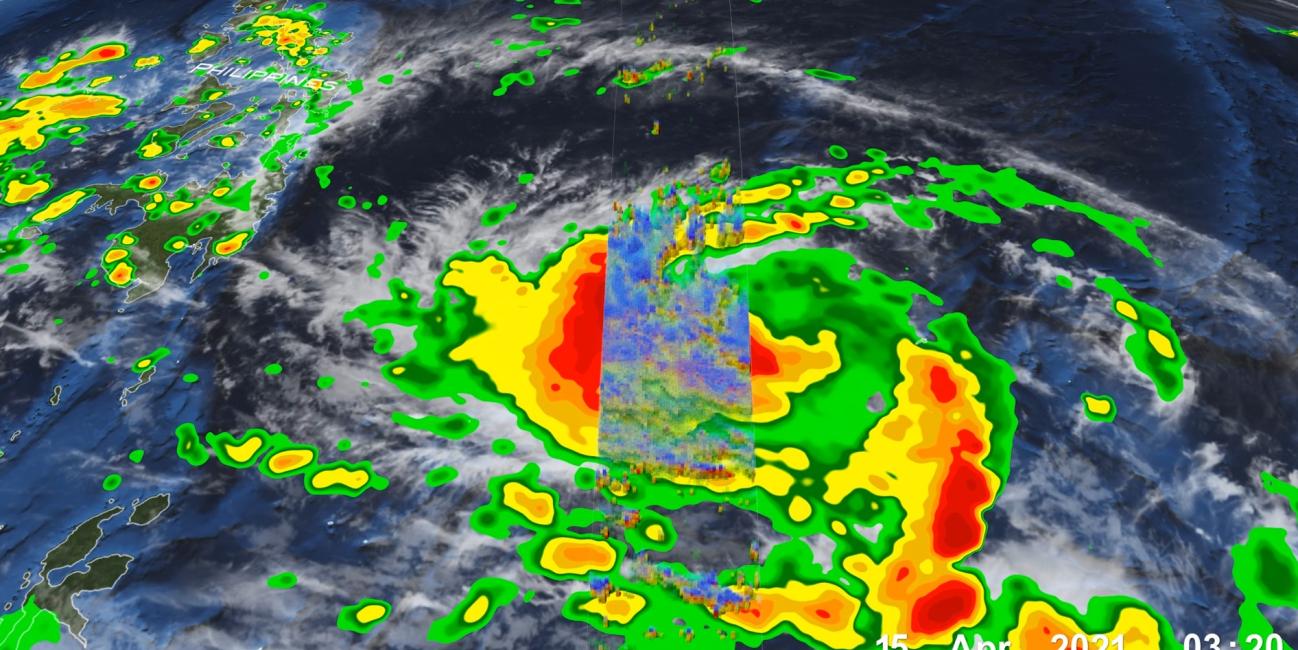
The second part of the animation shows a detailed look into the structure and intensity of the precipitation within Surigae. Surface rainfall estimates from the GPM Microwave Imager (GMI) show heavy rain (in red) wrapping around the western and southern portions of the storm. The GMI also reveals that Surigae does not yet have a complete eye with only weaker rain rates (shown in green) east of the center. GPM’s Dual-frequency Precipitation Radar (DPR) can actively scan the storm to provide a 3D perspective of its precipitation. Areas shaded in blue show frozen precipitation aloft. This is mainly in the form of snow but can also be graupel, which are rimed snow particles, and frozen drops, which are both present in the cores of active thunderstorms. Cross sections through Surigae obtained by the DPR show some of these frozen precipitation particles extending well about 10 km in the form of tall towers west of the center and are a result of strong updrafts within thunderstorms generating and carrying the particles aloft. Associated with this are intense rain shafts (shown in magenta) that extend down towards the surface. Together these features suggest that strong thunderstorms are actively releasing heat into Surigae’s circulation and priming the storm for possible further intensification.
Just over 9 hours later at 0000 UTC April 16th, JMA upgraded Surigae to a typhoon as the system was passing north of Palau and south of Yap. As the storm continued northwestward into the Philippine Sea, it underwent a period of rapid intensification beginning on the 16th that culminated in its peak intensity of 165 knots (~190 mph) at 1800 UTC on the 17th. Surigae’s minimum central pressure was estimated at 985 mb by JMA and 988 mb by JTWC. Fortunately, the storm recurved back out to sea and weakened before reaching the northern Philippines, Taiwan or the Ryukyus. However, Surigae was still blamed for 10 fatalities with 8 people reported missing.
Credits:
Animation by Alex Kekesi and the NASA Goddard Scientific Visualization Studio
Text by Stephen Lang (NASA GSFC / SSAI)