
GPM Flies Over Cat. 4 Hurricane Laura Twice As It Makes Landfall in Louisiana
Hurricane Laura began as a tropical depression on August 21st near the U.S. Virgin Islands, and over the next several days rapidly intensified to a dangerous category 4 hurricane at it moved towards the U.S. Gulf Coast. Laura made landfall as strong category 4 hurricane near Cameron, Louisiana shortly after midnight on August 27, 2020, bringing extreme rainfall, storm surge, and winds up to 150 mph.
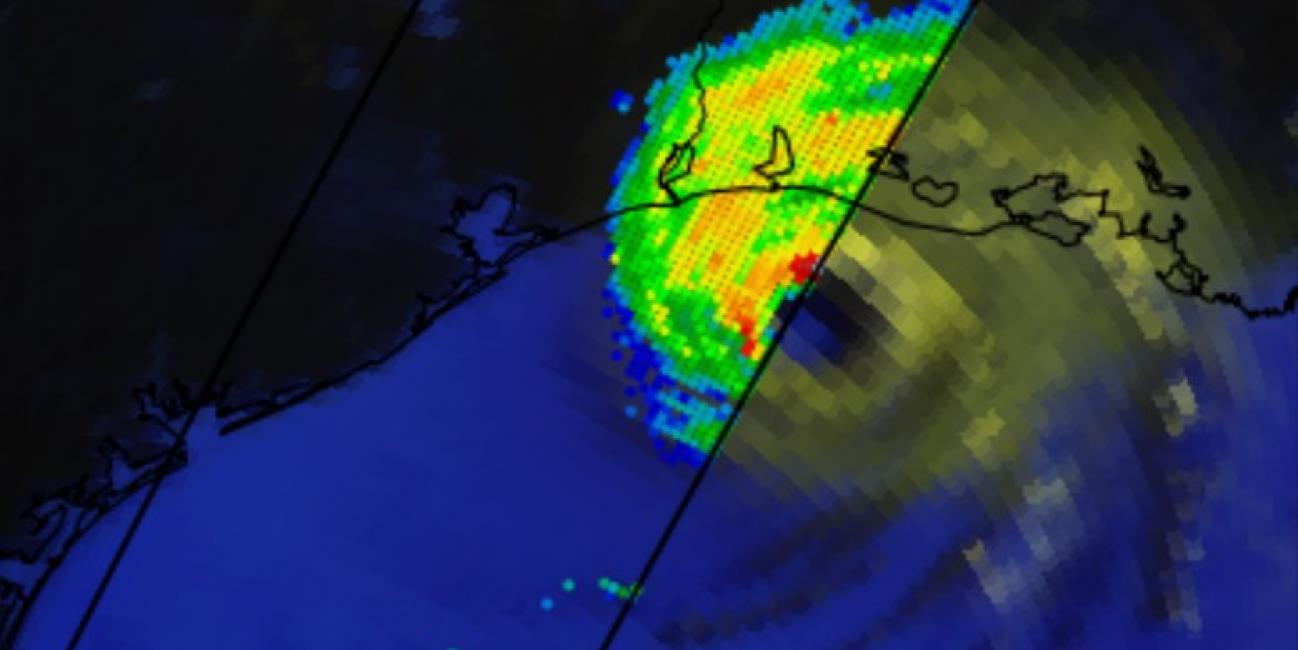
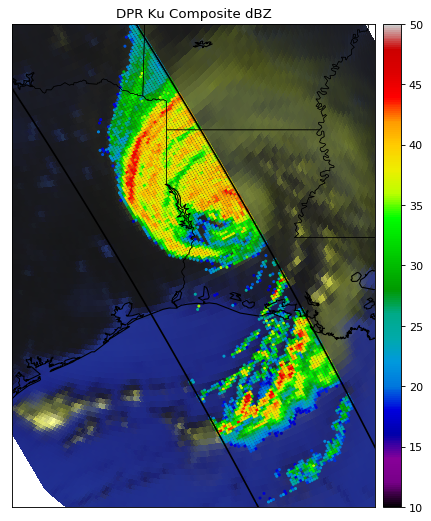
The NASA / JAXA GPM Core Observatory satellite flew over Hurricane Laura shortly before it made landfall at 10:00pm CT on Wednesday, August 26th, then again at 7:42am CT on Thursday, August 27th when it was over land, capturing data on precipitation within the storm.
This visualization from the 10:00pm CT August 26 GPM overpass shortly before Laura made landfall shows GPM Dual-frequency Precipitation Radar (DPR) data (center track) overlaid on GPM Microwave Imager (GMI) data showing the intensity of precipitation within the storm. Credit: Joe Munchak (NASA GSFC)
Two days before landfall Laura had been forecast to experience a period of weakening, but instead, it ended up intensifying and deepening until its inner core was interacting with land. Consistent with National Hurricane Center reports of continued intensifying is 3D evidence from the GPM Dual-frequency Precipitation Radar (DPR) instrument that Laura's eyewall contained vigorous convection at 10:00pm CT, about 3 hours before landfall. In this overflight GPM's DPR saw a 15km (~9 mile) tall hot tower in the eyewall. A nearby convective cell within the eyewall was shorter but contained an impressively strong 50-dBZ radar reflectivity signal in the mid-troposphere. Both observations are indicative of strong updrafts in the eyewall. A hot tower means that the eyewall's updrafts were strong enough to lift small ice hydrometeors up and out of the troposphere, the layer of the atmosphere that usually contains storm systems. The 50 dBZ mid-troposphere signal means that updrafts were strong enough that ice particles where held aloft long enough to grow large, perhaps hail-sized, despite their fall speed increasing as they grew larger.
The above visualization allows you to view GPM GMI and DPR data from the 10:00pm CT overpass in 3D. View fullscreen in STORM Event Viewer.
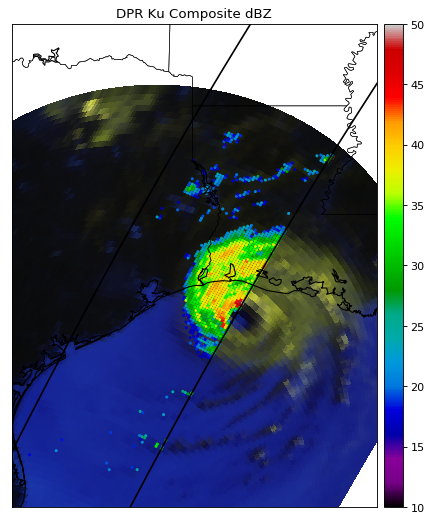
At approximately 7:42am CT on Thursday, August 27th, GPM flew over Hurricane Laura a second time. Compared to the pre-landfall overpass, the post-landfall radar and GMI data indicate less vigorous convection, with shallower storm tops and a transition to a large area of steady to heavy rainfall north and west of the center. However, some taller storms are still present in the eyewall remnant and bands over water.
In the GMI data shown in the background, some evidence of the inundation from Laura’s storm surge and heavy rainfall can be seen south of the storm center, where the surface appears water-like at the microwave frequencies.
This visualization from the 7:42am CT August 27 GPM overpass after Laura made landfall shows GPM Dual-frequency Precipitation Radar (DPR) data (center track) overlaid on GPM Microwave Imager (GMI) data showing the intensity of precipitation within the storm. Credit: Joe Munchak (NASA GSFC)
Credits:
Text by Owen Kelley, Jacob Reed, Joe Munchak (NASA GSFC)
Imagery by Joe Munchak (NASA GSFC)
Interactive visualization by Jason West (NASA GSFC)