
GPM Captures Powerful Typhoon Khanun Approaching the Ryukyus
The Northwest Pacific typhoon season has been quite active recently. Following in the wake of Super Typhoon Doksuri, which skirted the northern tip of Luzon July 25 and 26 and continued on to bring extreme rainfall to southeast coast of China, is yet another powerful storm - Typhoon Khanun. Khanun (known as “Falcon” in the Philippines) began in the West Pacific Ocean as an area of disturbed weather on July 24 situated well south of Guam and east of Palau. Over the next several days the system slowly intensified as it tracked northwestward towards the Ryuku Islands of southern Japan, becoming a tropical depression on July 27 as it entered the eastern Philippine Sea, a named tropical storm on July 28, and finally a typhoon on July 30 (local time) while moving through the north-central Philippine Sea.
Download this video in high resolution from the NASA Goddard Scientific Visualization Studio.
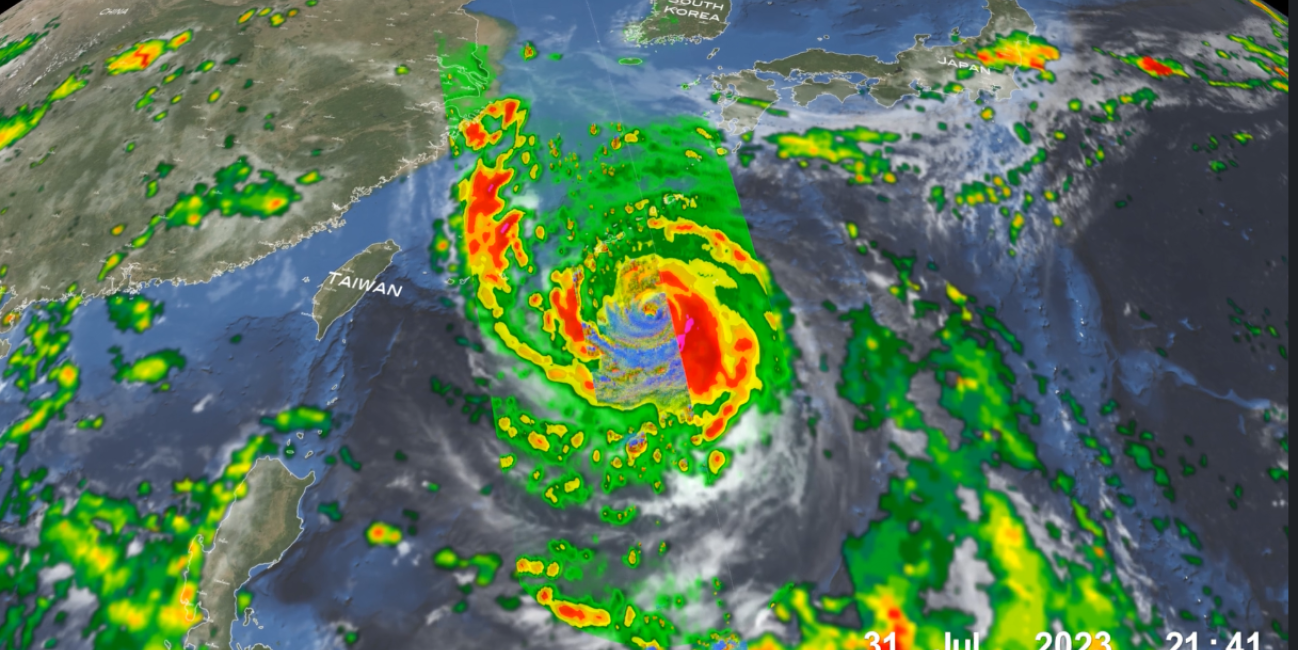
The above NASA animation shows Khanun over the northern Philippine Sea as it approached the Ryukyus. The first part of the animation shows a time loop of IMERG surface precipitation estimates beginning at 21:11 UTC July 30 (6:11 am JST July 31) overlaid on infrared (IR) cloud top data. The animation begins when Khanun was already a strong typhoon with sustained winds estimated at 120 mph by the Joint Typhoon Warning Center (JTWC), the equivalent of a Category 3 hurricane on the Saffir-Simpson scale. IMERG shows that Khanun is already well-developed at this stage with a large, mostly symmetric precipitation field, especially near the center where moderate to heavy rain (orange and red areas) surrounds a well-defined eye. Further out, several well-formed rainbands wrap around the southern, eastern, and northern quadrants. Over the next 24 hours IMERG shows how Khanun’s overall symmetry continued to improve, with rainbands wrapping further around the western side of the storm resulting in a highly symmetric rain field. The eye persisted throughout this period, but a distinct gap in the rain intensity between the inner eyewall and outer rainbands (known as a moat) began to emerge. This moat is typically indicative of the start of an eyewall replacement cycle wherein a new outer eyewall forms outside of the original inner eyewall, and given enough time, eventually replaces it.
It was around this time at 21:41 UTC July 31 (6:41am JST Aug. 1) that the GPM Core Observatory satellite flew over the center of Khanun. The second part of the animation shows a detailed look at the structure and intensity of precipitation within Khanun from GPM. Surface rainfall estimates from the GPM Microwave Imager (GMI) and Dual-frequency Precipitation Radar (DPR) show very heavy rain (magenta and red areas) located mainly south and east of the center, as well as a close-up view of the partial double eyewall structure where an outer ring of very intense rain (magenta) is separated from another area of intense rain located in the southeastern part of the eyewall by weaker, though still heavy, rain (shown in red). The DPR actively scanned Khanun to provide a 3D perspective of its precipitation. Areas shaded in blue show frozen precipitation aloft, mainly in the form of snow but also graupel (rimed snow particles) and frozen drops – both of which are present in the cores of active thunderstorms. The DPR precipitation heights show two arcs of higher tops associated with the original eyewall and an outer rainband separated by a distinct ring of lower tops that is associated with the emerging moat feature. The DPR also shows an extremely tall tower reaching to around 9 miles (15 km, shown as a darker blue tower) that is associated with the area of intense surface rain in the southeastern part of the eyewall. This deep thunderstorm located in the eyewall is known as a convective burst and often results in some strengthening as it releases a large amount of heat into the storm’s core. At the time of the GPM overpass Khanun was nearing its peak intensity with maximum sustained winds estimated at 135 mph by JTWC, the equivalent of a Category 4 hurricane. Khanun would go on to reach its peak intensity of 140 mph about 9 hours after the GPM overpass as it neared Okinawa.
Despite not making landfall, Khanun brought widespread power outages and was blamed for 2 fatalities as it passed the southern tip of the island. After passing Okinawa, Khanun began to weaken as it moved into the East China Sea where it is currently located. Forecasts indicate the storm will weaken even further and turn back northeastward in the direction of the northern Ryukyus.
Credits:
Visualization by Alex Kekesi (GST / NASA GSFC) and the NASA Goddard Scientific Visualization Studio
Text by Steve Lang (SSAI / NASA GSFC) and Jacob Reed (Telophase / NASA GSFC)