
Hurricane Franklin Re-intensifies over the Western Atlantic
After becoming a tropical storm in the east-central Caribbean on the afternoon of Aug. 20 and moving generally westward for two days, Tropical Storm Franklin took a northward track and struck the southern coast of the Dominican Republic south of Barahona on the morning of Aug. 23 as a moderate tropical storm with sustained winds reported at 50 mph by the National Hurricane Center (NHC). Franklin brought heavy rains and flooding to the area, resulting in landslides, power outages and at least 2 fatalities in the Dominican Republic according to media reports. After traversing the mountainous island of Hispaniola, Franklin emerged into the western Atlantic as a minimal tropical storm on the evening of Aug. 23. Despite being back over warm water and continued thunderstorm activity within the storm, over the next few days Franklin was subject to strong westerly wind shear, forcing the storm back towards the east and inhibiting it from developing. On Aug. 26 the wind shear abated and allowed Franklin to re-intensify into a hurricane and take a northwesterly track. Aug. 27 saw Franklin continue to intensify into a Category 2 storm as is started to re-curve more northward, well southwest of Bermuda and well east of the northern Bahamas and east coast of Florida. On the morning of Aug. 28 Franklin reached Category 3 intensity, becoming the first major hurricane of the 2023 season. However, Franklin was not done strengthening and continued to rapidly intensify into a Category 4 storm, with sustained winds reported at 145 mph by the NHC at 9:00 a.m. EDT when it was about 485 miles southwest of Bermuda. Franklin maintained this intensity throughout most of the day as it moved due north before reaching its peak intensity at 8:00 p.m. EDT with sustained winds reported at 150 mph.
Download this video from the NASA Goddard Scientific Visualization Studio
The above animation follows Ian as it intensified over the western Atlantic east of the Bahamas, and moved north away from Hispaniola. The animation begins with a 24-hour time loop of surface rainfall estimates starting at 10:11 pm EDT Aug. 27 (02:11 UTC Aug. 28) from NASA’s IMERG precipitation product. These surface rainfall estimates are useful for showing both the track and evolution of general storm characteristics. IMERG shows that as Franklin strengthened from a Category 2 to Category 4 hurricane, the areas of moderate (shown in orange) to heavy (shown in red) precipitation became more evenly distributed and symmetric as they wrapped around the center. Symmetric structures like these indicate a mature, intense circulation. The final IMERG image shows what appears to be two concentric rings of heavy precipitation surrounding the center. This indicates a double eyewall structure, and strongly suggests Franklin was about to undergo an eyewall replacement cycle.
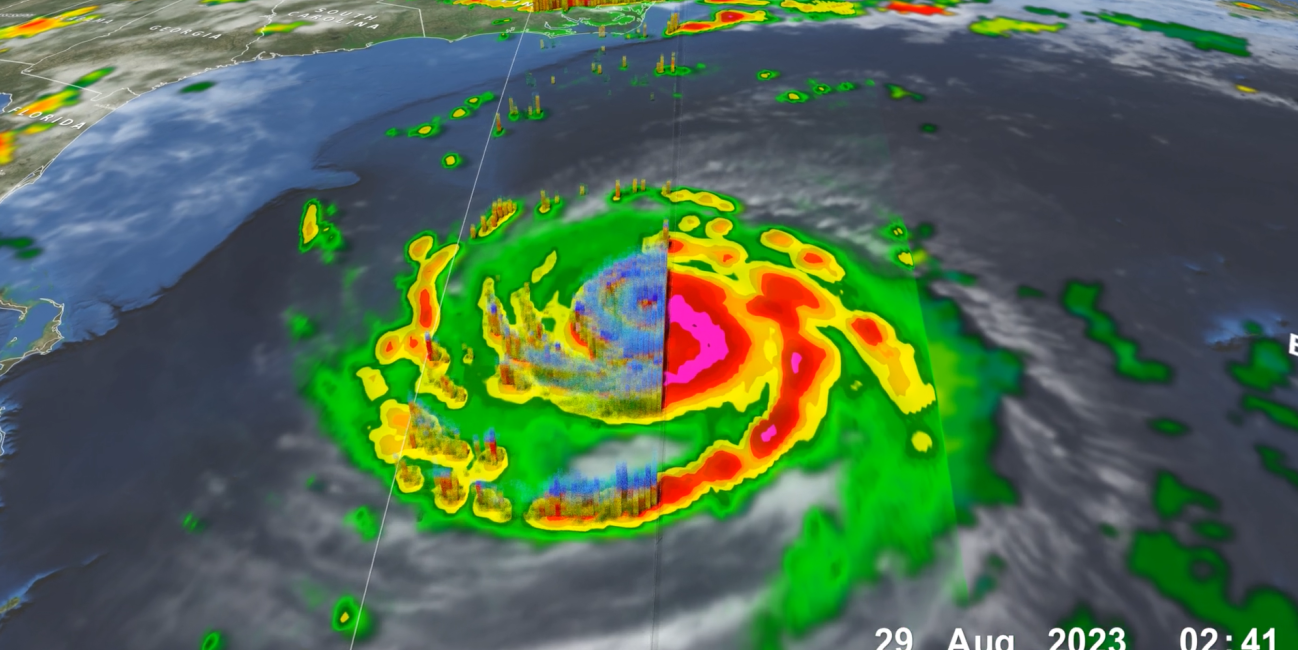
The second part of the animation shows a detailed look at the structure and intensity of the precipitation within Franklin using observations from the NASA / JAXA GPM Core Observatory satellite when it flew over the center of Franklin around 10:41 pm EDT Aug. 28 (02:41 UTC Aug. 29) when the storm was at its peak intensity. Surface rainfall estimates from the GPM Microwave Imager show heavy rain (in red) wrapping completely around the center of the storm, with intense rain rates (shown in magenta) wrapping around the northern and eastern side of the center. A somewhat separated area of very intense rain is located immediately northwest of the center. Further out from the center, heavy rainbands also wrap around the storm, mainly on the eastern side.
GPM’s Dual-frequency Precipitation Radar (DPR) actively scanned the storm to provide a 3D perspective of its precipitation. Areas shaded in blue show frozen precipitation high in the atmosphere, mainly in the form of snow but also graupel (rimed snow particles) and frozen drops, which are both present in the cores of active thunderstorms. The DPR reveals two separate rings of taller precipitation tops surrounding the center, an inner ring and an outer ring. This type of structure also suggests that Franklin was undergoing an eyewall replacement cycle during the time of the overpass, wherein an outer eyewall forms outside the original inner eyewall before constricting and replacing it. This often signals the end of further intensification. At the time of the GPM overpass Franklin was strong Category 4 storm with sustained winds of 150 mph. The following day on Aug. 29 Franklin began to steadily weaken as it recurved to the northeast before then passing 140 miles north of Bermuda on Aug. 30.
Download this video (right-click -> "Save As")
This animation shows IMERG estimated rain rates (blue and yellow shading) and accumulations (green and purple shading) from Aug. 20, 8:00 p.m. EDT (00:00 UTC) through Aug. 31 3:30 a.m. ET (07:30 UTC) alongside the storm tracks of Hurricanes Idalia and Franklin. National Hurricane Center storm track and intensity estimates are shown by the multi-colored lines, and cloudiness is shown in white and gray shading from geosynchronous satellite infrared sensor estimates.
By the end of the animation, Idalia had crossed the Big Bend region of Florida as well as southeastern Georgia and South Carolina before emerging into the Atlantic Ocean as a tropical storm. IMERG estimated rainfall from Idalia to be over 2 inches (green shading) across large parts of the U.S. Southeast, with totals in some areas of Georgia and the Carolinas estimated at higher than 6 inches (light purple shading). These totals were broadly consistent with local rain gauge measurements by the National Weather Service. IMERG is a uniquely valuable data product for tracking extreme weather events like hurricanes, as it allows precipitation to be estimated over oceans as well as land across the storm’s entire track.
Credits:
First visualization by Alex Kekesi (GST / NASA GSFC) and the NASA Goddard Scientific Visualization Studio
Second visualization by Jason West (NASA GSFC, PPS, KBR)
Text by Steve Lang (SSAI / NASA GSFC) and Jacob Reed (Telophase / NASA GSFC)