
Hurricane Otis Strikes Acapulco, Mexico, as a Powerful Category 5 Storm
After rapidly intensifying overnight, Hurricane Otis made landfall near Acapulco, Mexico around 1:25 a.m. CDT (06:25 UTC) on Wednesday Oct. 25 as a powerful Category 5 hurricane. Otis had maximum sustained winds estimated at 165 mph by the National Hurricane Center (NHC), making it the first Category 5 as well as the most powerful storm to hit the Pacific coast of Mexico on record.
Otis formed into a tropical depression (TD 18-E) on the morning of Sunday Oct. 22 about 530 miles (850 km) south-southeast of Acapulco from a broad area of low pressure. The depression was moving slowly northward, and early forecasts did not expect the system to become very strong due to expected wind shear. However, TD 18-E was over warm water, resulting in increased thunderstorm activity and the system to intensifying into a weak tropical storm. Upon strengthening, the storm was named Otis later that same afternoon. The following day on Oct. 23, thunderstorm activity persisted but was counteracted by easterly wind shear that inhibited Otis’ ability to organize, resulting in modest strengthening to a moderate tropical storm, with the NHC estimating maximum sustained windspeeds of 50 mph. However, things began to change on Oct. 24. During the early morning the wind shear abated, allowing Otis to become a strong tropical storm on the morning of Oct. 24 and a hurricane by early afternoon.
Download in high resolution from the NASA Goddard Scientific Visualization Studio
The above animation shows Otis in the eastern Pacific Ocean as it’s making its way northward towards the southwest coast of Mexico. The animation begins with a 24-hour time loop of surface rainfall estimates from NASA’s IMERG precipitation product starting at 7:11 a.m. CDT (12:11 UTC) Oct. 23 when the center was about 400 miles (640 km) south-southeast of Acapulco. IMERG shows Otis in the process of becoming better organized with the emergence of several banded structures, including the appearance of an eye structure at times. IMERG also shows Otis becoming more symmetric. Initially, most of the rain was located west of the center of circulation, consistent with the easterly wind shear, but later as the shear abated, rain wrapped completely around the center.
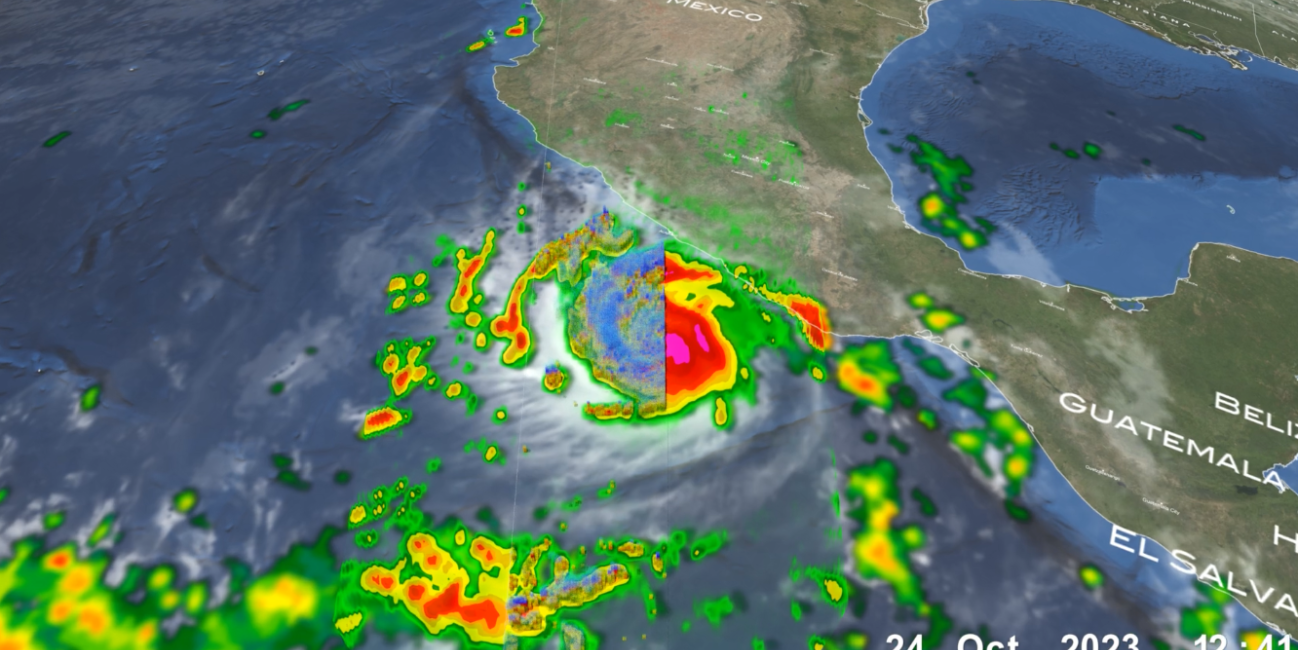
The second part of the animation shows a detailed look into the structure and intensity of the precipitation within Otis from the GPM Core Observatory when it overflew the storm around 7:41 a.m. CDT (12:41 UTC) on Oct. 24 when the center was about 175 miles (280 km) south-southeast of Acapulco. Surface rainfall estimates from the GPM Microwave Imager show heavy rain rates in red completely surrounding the center of the storm, with areas of intense rain rates shown in magenta both west and east of the center. Some areas of heavy rain are just beginning to move over the Mexican coastline. GPM’s Dual-frequency Precipitation Radar (DPR) scanned the western half of the storm, providing a 3D look at Otis’s precipitation field. Areas shaded in blue show frozen precipitation high in the atmosphere, mainly in the form of snow and graupel (rimed snow). The DPR shows a nearly continuous band of deeper convective towers associated with the rainband west of the center as well as enhanced tops near the center. Other deep towers are likely present east of the center where there are areas of intense surface rain outside of the DPR’s swath. At the time of the GPM overpass Otis was still a strong tropical storm, with the NHC reporting sustained winds at 65 mph. Later that day, Otis would undergo a remarkable rapid deepening cycle, intensifying into a Category 3 storm by 4:00 p.m. CDT, a Category 4 storm by 7:00 p.m., and a Category 5 storm by 10:00 p.m., remaining at that strength when it made landfall.
Credits:
Visualization by Alex Kekesi (NASA GSFC / GST) and the NASA Goddard Scientific Visualization Studio using GPM data.
Text by Steve Lang (SSAI / NASA GSFC) and Jacob Reed (Telophase / NASA GSFC)