
NASA Tracks Tropical Moisture Flooding Washington
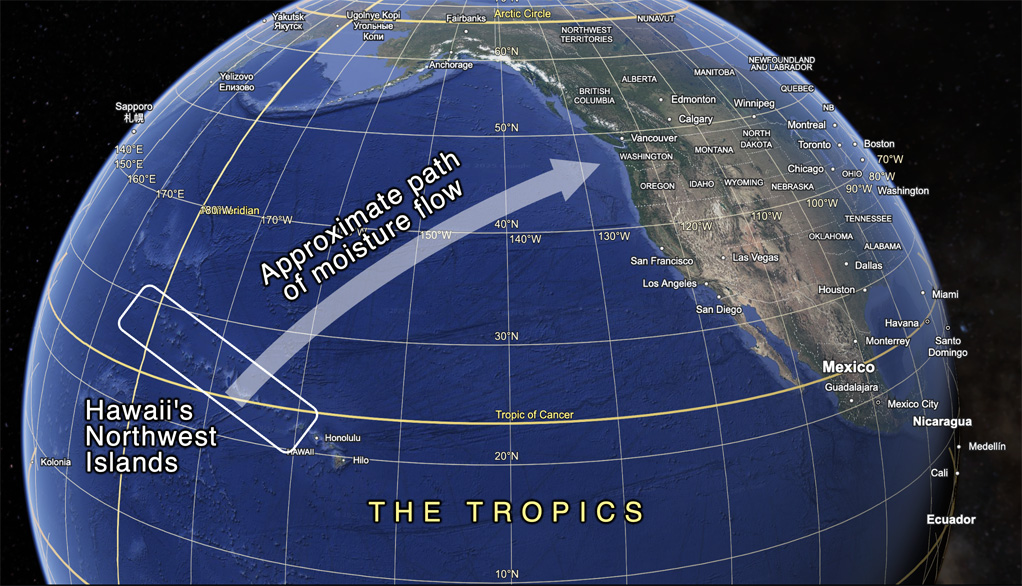
Several atmosphere rivers have recently carried plumes of moisture from the Tropics toward the United States. These plumes of water vapor have contributed to flood-producing storms over Washington State during the first three weeks of December 2025. The illustration below shows the approximate path that the moisture took to reach the United States.
NASA's IMERG algorithm stitches together observations from multiple satellites to estimate the precipitation that falls across the globe. IMERG stands for Integrated Multi-satellitE Retrievals for the Global Precipitation Measurement (GPM) mission. NASA's Goddard Space Flight Center is home to the team of scientists who work to improve this algorithm and for the computing power that enables the algorithm to process more than a petabyte of observations.
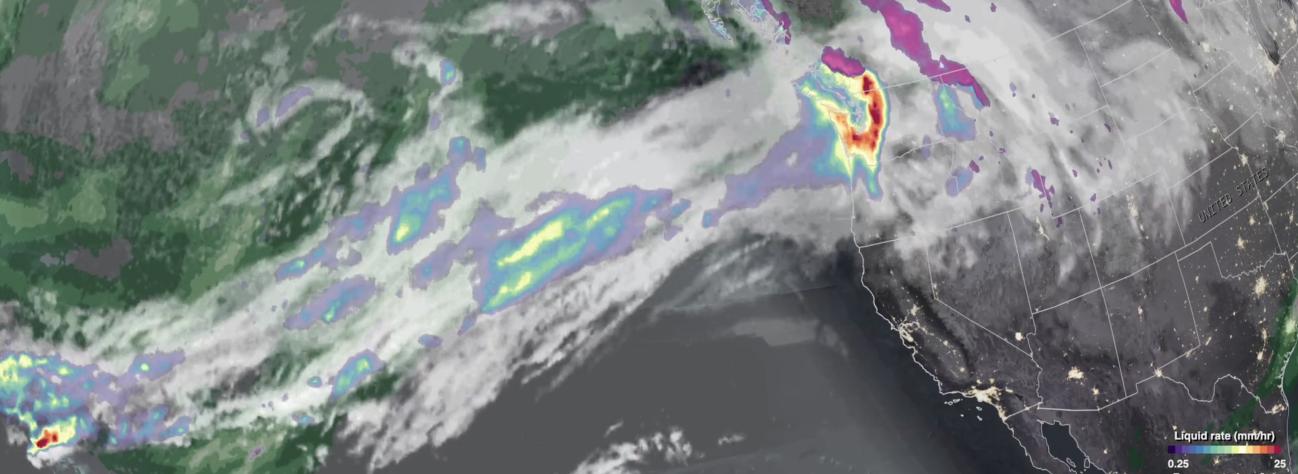
The animation below is built up from frames that each cover a 30-minute period. It shows rainfall rate with a blue-red color table and snowfall rate with a violet-pink color table. Clouds are shown in semi-transparent gray. Underneath the clouds and precipitation rates, the animation shows precipitation accumulation with a green-purple color table. At the end of the animation, the total accumulation remains after other data layers are removed. The animation covers December 1 through 14, 2025.
To get a more precise idea of how much precipitation fell, the image below shows contours of precipitation accumulation during December 1 through 15. In this image, accumulation is measured in inches and is the sum of the depth of rainfall plus the depth of liquid that would be produced by melting any snowfall. This quantity is called the liquid-equivalent depth of the snowfall.
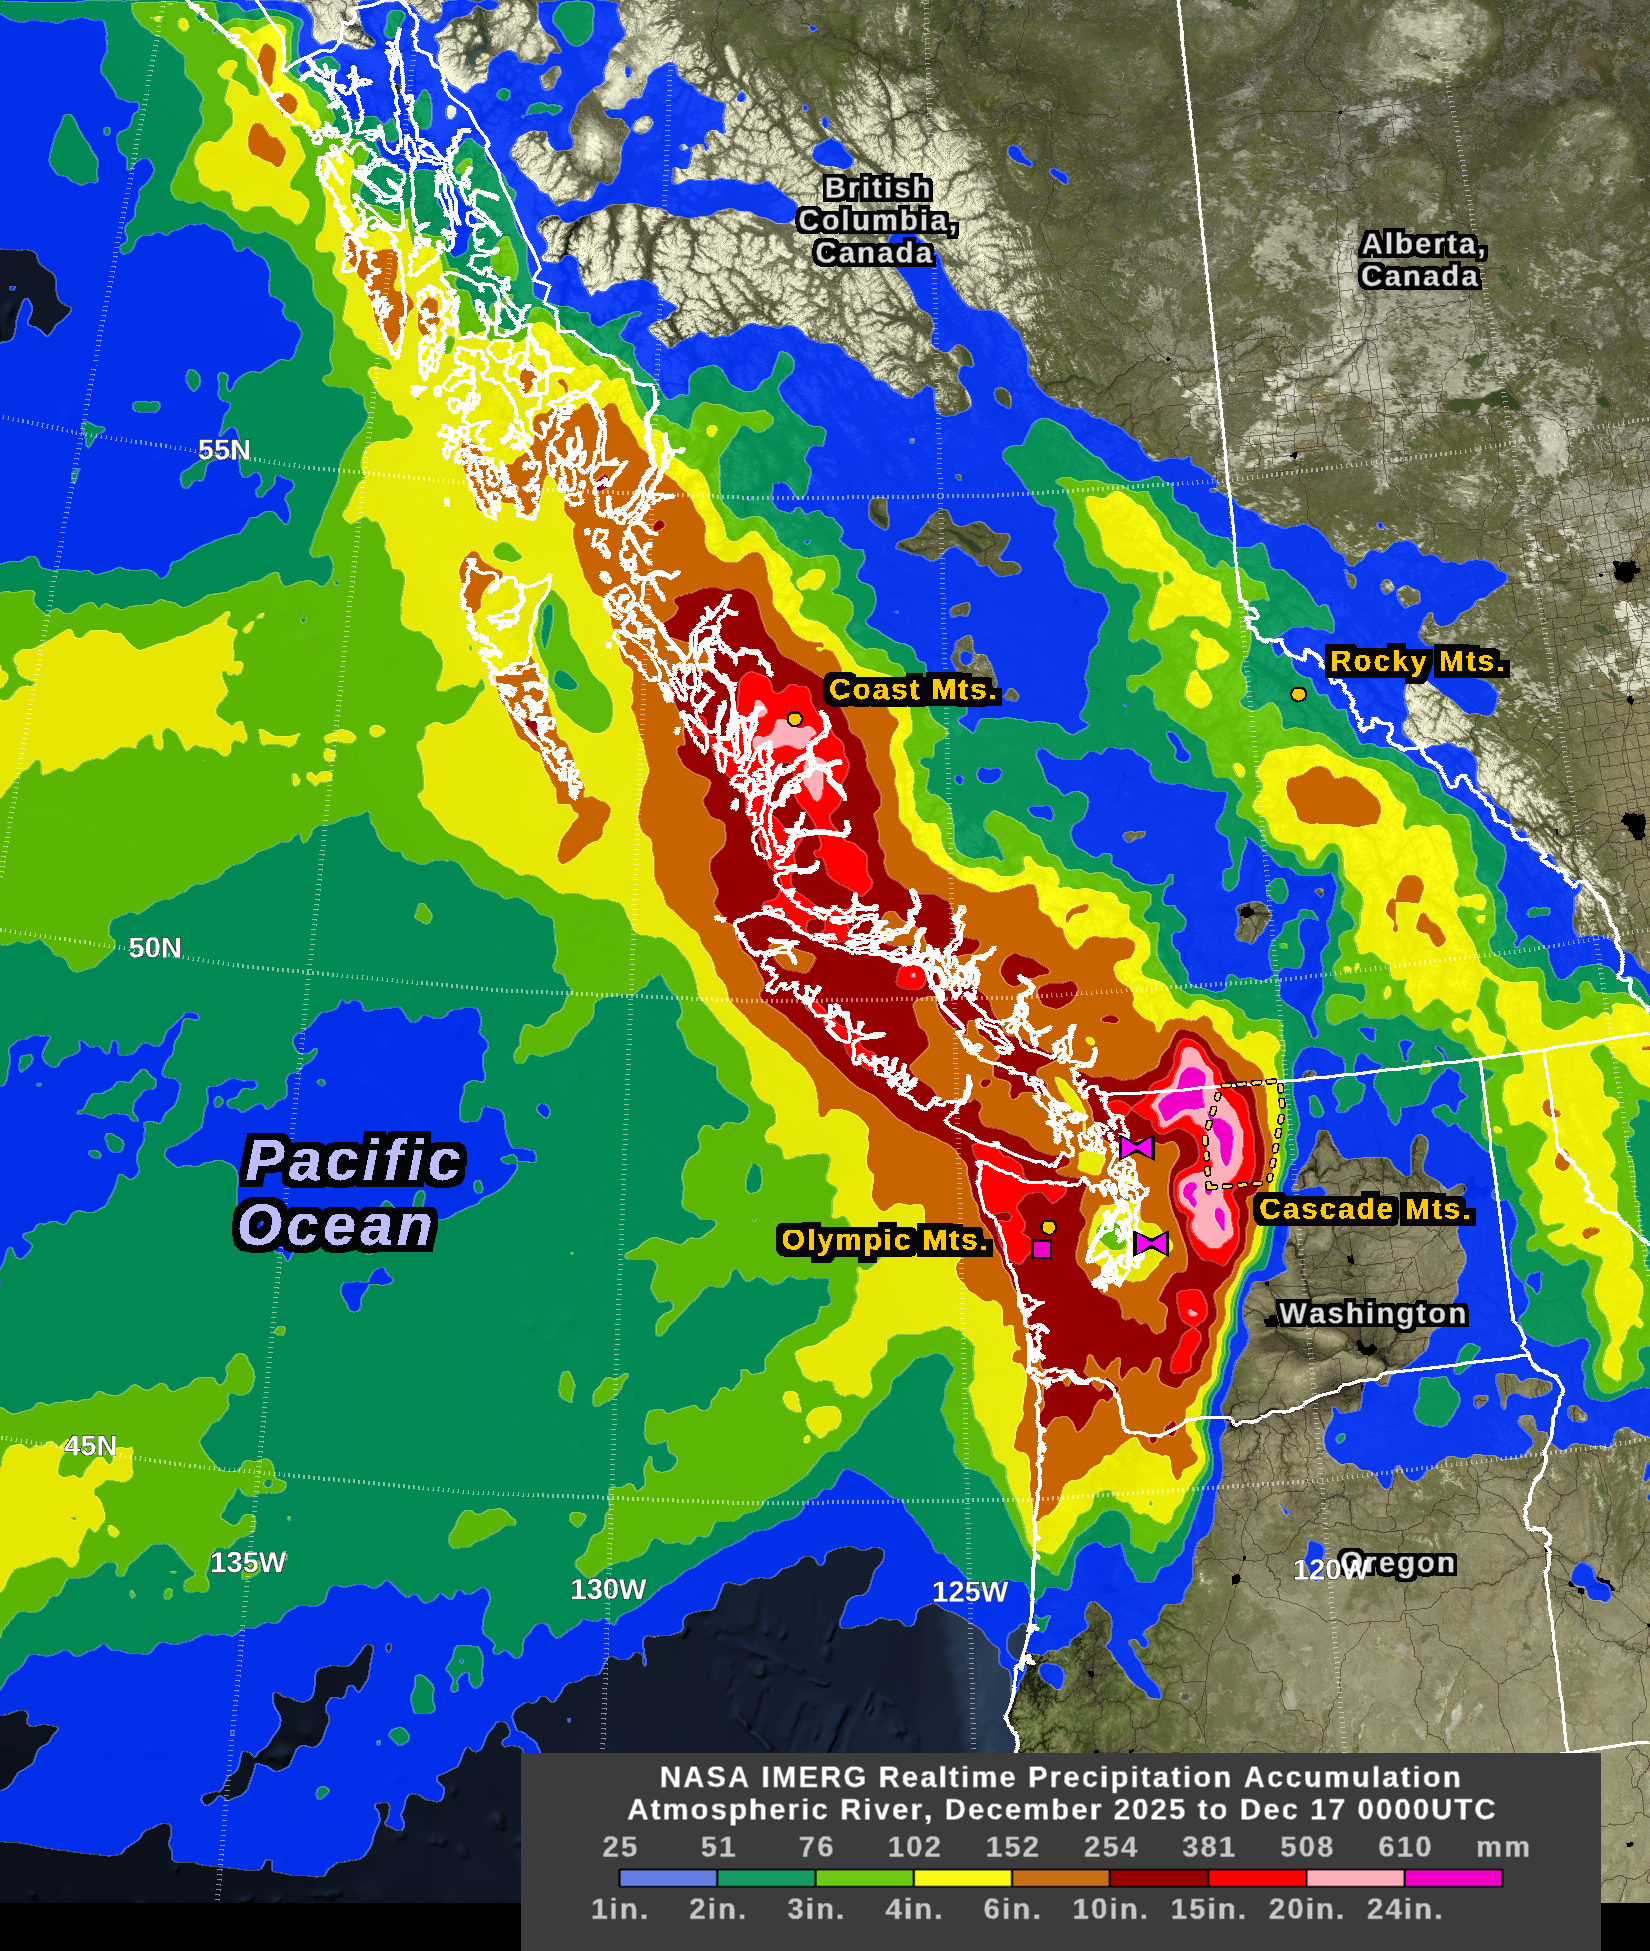
The above image shows two parallel trails of rainfall that stretch southwest to northeast across the Pacific Ocean. The northern trail reached Canada and the southern trail reached Washington State. These precipitation trails are evidence of the large amount of water vapor being transported along these routes, compared with the dryer air over nearby ocean regions.
Over the Pacific Ocean, the rainfall produced by these atmospheric rivers was fairly modest at 1 to 6 inches of accumulation during the first half of December 2025. The accumulation was more substantial over land. The large accumulations over North America were due in part to mountain ranges lifting the moist, oceanic, tropical air. IMERG estimated that the two-week precipitation total exceeded 15 inches over Washington's Olympic Mountains, and further inland, the total exceeded 24 inches over parts of Washington's Cascade Mountains.
During the first half of December western Washington suffered landslides, flooding, and power outages as a result of these atmospheric rivers. These storms also closed several highways that cross the Cascade Mountains. To see more clearly the geographic variation of rainfall, the zoomed-in image below shows just Washington State.
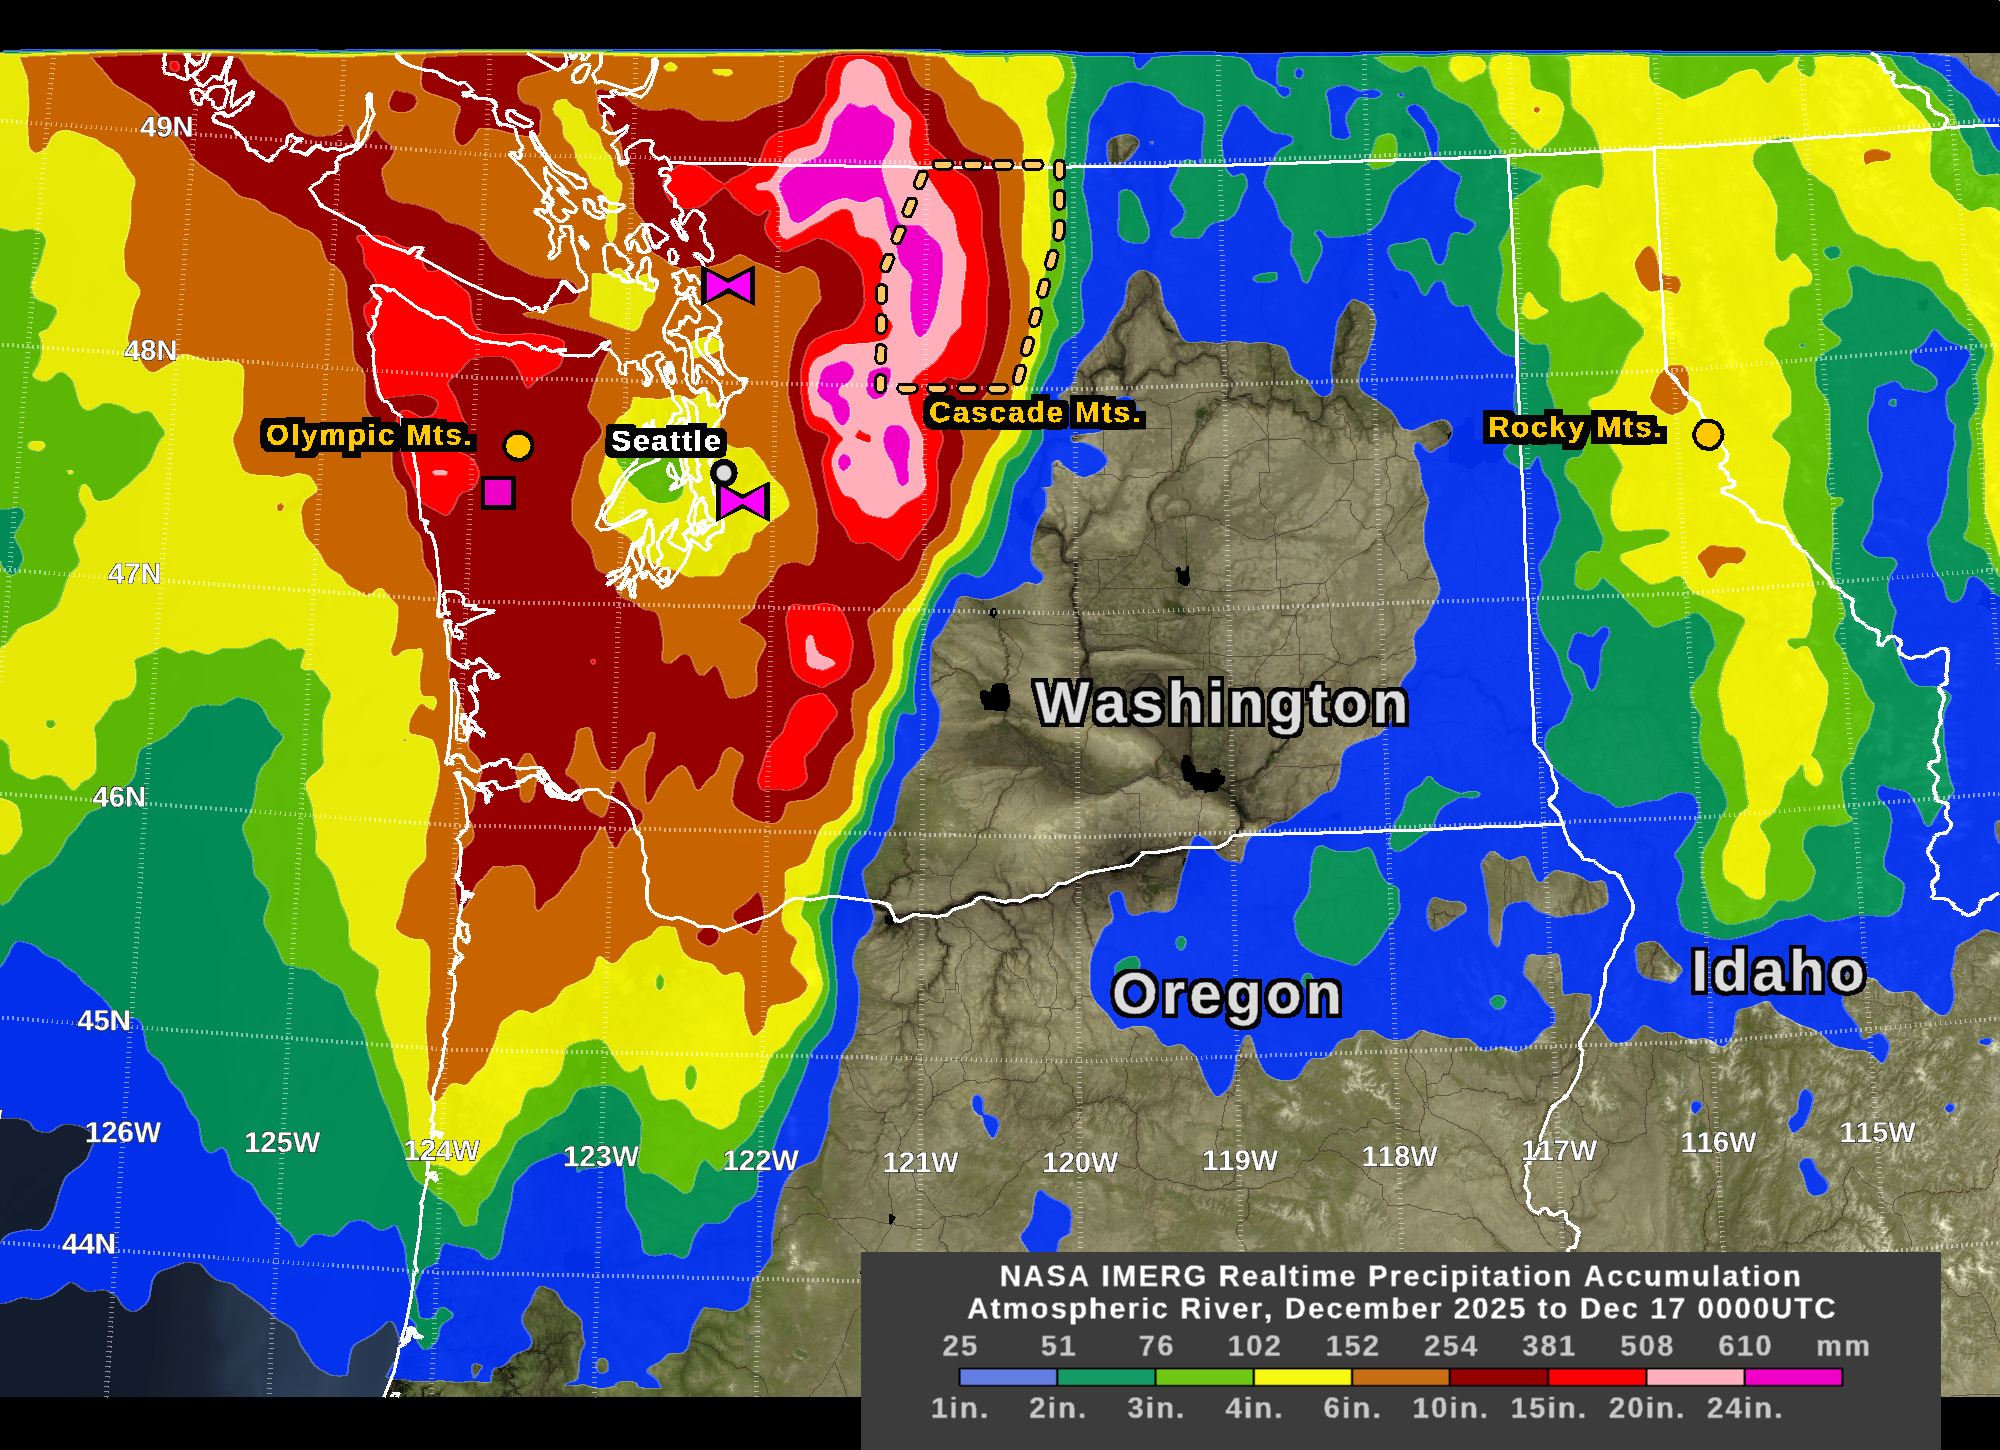
In the yellow-dotted region of the Cascade Mountains, a NOAA dataset broadly agreed with the NASA IMERG precipitation estimate, which is notable for two reasons. For one thing, much of the precipitation in this area fell as snow, which is more difficult to estimate from satellite observations than moderate rainfall. Second, any type of precipitation is difficult to estimate over mountainous regions, whether using ground radars, satellites, or rain gauges. NOAA generated its near real-time estimate over the United States using ground radars, rain gauges, and satellites. NOAA's product is called "Stage IV." IMERG's near real-time estimates were generated over the whole globe using satellite observations calibrated against long-term gauge averages. The IMERG precipitation estimates also factored in the storm motion that was estimated from winds in a weather model.
Near the coast, the NASA and NOAA datasets diverged somewhat. Only the NOAA dataset saw a region of 24-inch accumulation over the Cascade Mountains, a compact mountain range west of Seattle. A rain gauge in the Cascades also reported over 24 inches of precipitation during the first half of December 2025, as indicated in the image by the cyan-color square. The two bow-tie-shaped symbols near Seattle indicate locations where the U.S. Geological Survey measured record river height. The rising water at these river gauges was a result of runoff from the heavy rainfall. The record river height occurred on December 11 and 12.
For more information about IMERG and the Global Precipitation Measurement mission, please visit the GPM website at https://gpm.nasa.gov/.
The NASA Disasters Program’s Disasters Response Coordination System (DRCS) has activated to support ongoing response efforts by the Washington State Emergency Operations Center. The DRCS team has produced and shared multiple satellite-based products to assess flood extent and landslide hazard risk. Learn more.
Credits and Data Sources
Animation and imagery by Jason West (NASA/PPS/KBR) and Owen Kelley (NASA/PPS/GMU).
Story by Owen Kelley (NASA/PPS/GMU).
Schematic diagram (first image) based on Google Earth.
---
Atmospheric Rivers: Descriptions of individual atmospheric-river events striking North American are available from the Center for Western Weather and Water Extremes.
IMERG estimates (HDF5): Available from NASA at https://gpm.nasa.gov/.
NOAA Stage IV gridded precipitation estimates (NetCDF): Daily Stage IV precipitation estimates were downloaded from NOAA at https://water.noaa.gov/resources/downloads/precip/stageIV/2025/12/. Stage IV NetCDF files do not contain the latitude and longitude of grid-cell centers. One way to calculate these latitude and longitude values is to download one Stage IV GeoTIFF file and use Python code executed in QGIS.
NOAA Stage IV gridded snowfall estimates (NetCDF): Taking the difference of two year-to-date NetCDF files allows one to calculate snowfall that occurred between two dates. Data downloaded from https://www.nohrsc.noaa.gov/snowfall_v2/. Grid-box-center latitude and longitude calculated with Python in QGIS.
GHCN Daily rain-gauge precipitation estimates in the (CSV format): Files for individual stations downloaded from https://www.ncei.noaa.gov/pub/data/ghcn/daily/by_station/. Format definition from the readme.txt file. Read lines that contain the PRCP (e.g., "precipitation" variable) which is stored in tenths of a millimeter. The gauges of interest were identified on the map provided by ArcGIS as described on the metadata page.
USGS stream-flow observations: The stream-flow observations for individual stream gauges are compiled by NOAA at https://water.noaa.gov.