
Typhoon Kammuri Hits the Philippines
Surface rainfall accumulations (mm) estimated from the NASA IMERG satellite precipitation product from 00 UTC 25 November to 03 UTC 4 December 2019 in association with the passage of Typhoon Kammuri. Image from NASA GSFC using IMERG data archived at https://giovanni.gsfc.nasa.gov/giovanni/. This image was produced with the Giovanni online data system, developed and maintained by the NASA GES DISC.
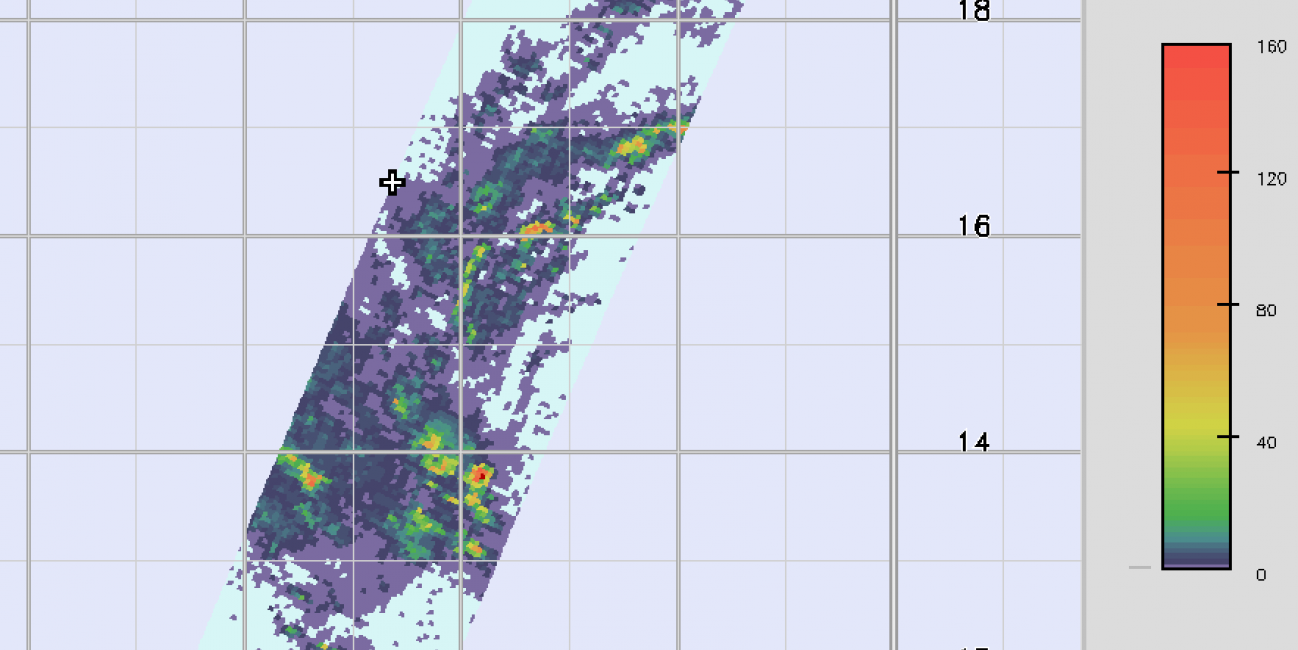
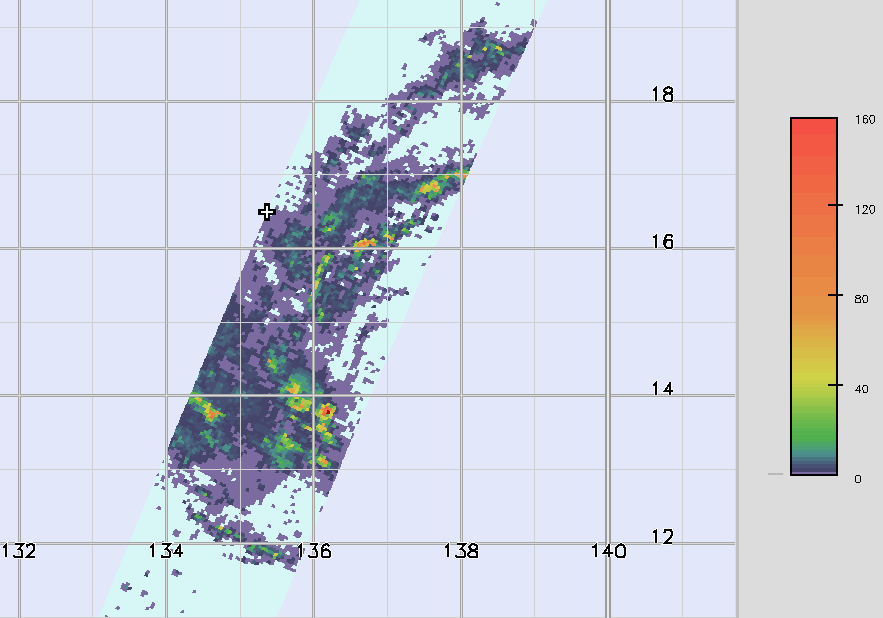
While the Atlantic hurricane season officially ended on November 30th, Typhoon Kammuri (known as Tisoy in the Philippines), which recently struck the central Philippines as a powerful Category 4 typhoon, is a reminder that the Pacific typhoon season is not yet over. In fact, while typhoon season does peak from around June through November, similar to the Atlantic, typhoons can occur throughout the year in the Pacific. Kammuri first formed into a tropical depression from an area of low pressure on the 25th of November north of Micronesia in the west central Pacific about 500 miles southeast of Guam. Kammuri intensified slowly and was still a tropical storm when the center passed about 130 miles south of Guam on the evening of the 26th. As the storm made its way through the eastern and central Philippine Sea over the next few days it was kept in check at times by moderate wind shear and hovered around typhoon intensity. During this period, the GPM core satellite overflew the storm. The first image was taken at 18:27 UTC 29 November (3:27 am Palau Time, PWT, 30 November) 2019 and shows surface rain rates within Kammuri from the GPM Dual-polarization Radar (DPR) when the storm was about 800 miles east of the Philippines. At the time, Kammuri was a Category 1 typhoon with sustained winds estimated at 85 mph by the Joint Typhoon Warning Center (JTWC). GPM shows areas of moderate to heavy rain (shown in yellow, orange and red, respectively) organized into loose bands rotating around the northern and western side of the storm. The eye, which is located along the right side of the image, is identifiable by the curvature in the inner rain bands, but the eyewall itself appears rather weak. These features are consistent with Kammuri having a well-developed though not yet powerful circulation. This would change over the next few days as Kammuri began to approach the Philippines. Initially, Kammuri weakened slightly after the time of the GPM overpass, but then on the evening of December 1st (local time), the storm began a rapid deepening cycle and intensified from a Category 1 typhoon with sustained winds estimated at 80 mph by JTWC at 12:00 UTC (9:00 pm PWT) on the 1st to a Category 4 storm with sustained winds of 130 mph just 24 hours later. It was at this time that Kammuri made its first landfall in the Philippines around 11:00 pm local time near Gubat in the Bicol region in the Province of Sorsogon along the southeastern tip of Luzon. As it continued on westward through the central Philippines, Kammuri weakened, crossing the island of Mindoro as a Category 2 storm before exiting the Philippines into the eastern South China Sea.
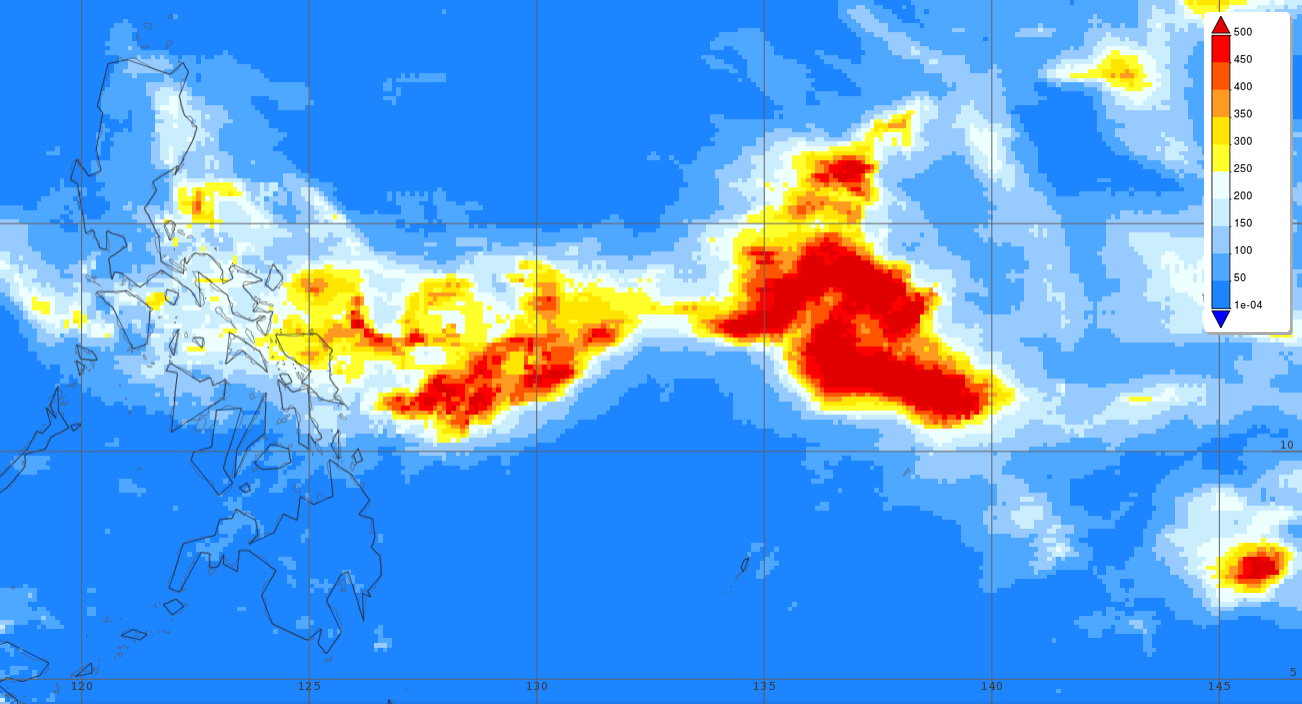
Surface rainfall accumulations (mm) estimated from the NASA IMERG satellite precipitation product from 00 UTC 25 November to 03 UTC 4 December 2019 in association with the passage of Typhoon Kammuri. Image from NASA GSFC using IMERG data archived at https://giovanni.gsfc.nasa.gov/giovanni/. This image was produced with the Giovanni online data system, developed and maintained by the NASA GES DISC.
In addition to its powerful winds, Kammuri brought heavy rains to the Philippines. IMERG, the Integrated Multi-satellitE Retrievals for GPM, is a unified satellite precipitation product produced by NASA to estimate surface precipitation over most of the globe. With IMERG, precipitation estimates from the GPM core satellite are used to calibrate precipitation estimates from microwave and IR sensors on other satellites to produce half-hourly precipitation maps at 0.1o horizontal resolution. The second image shows IMERG surface rainfall accumulations for the period 25 November through 3 December 2019 for the Philippines and the surrounding region from the time when Kammuri first became a tropical depression southeast of Guam until it had passed over Mindoro and into the South China Sea. The heaviest rains associated with Kammuri by far are off shore, especially over the central Philippine Sea where the cyclone stalled for a period producing rainfall totals well over 500 mm (~20 inches, shown in red). Over land, most of the central Philippines, including southern Luzon, received on the order of 150 mm or more (over 6 inches, light blue areas) with the highest amounts over the northern half of the island of Samar where rainfall totals are on the order of 250 to 350 mm (~10 to 14 inches, shown in yellow and light orange). So far, Kammuri is being blamed for up to 17 fatalities in the Philippines. After leaving the Philippines, Kammuri weakened significantly and is expected to weaken even further and dissipate as the cyclone is sheared apart and driven southward by the northeast monsoon.