

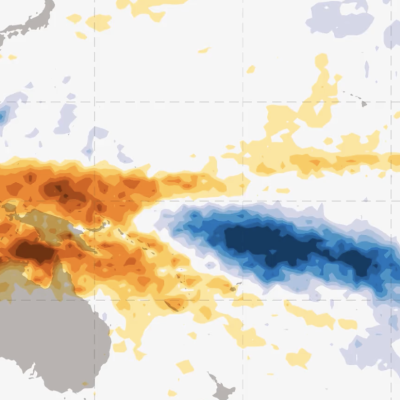
el nino

MJO Phase 1 precipitation anomaly from IMERG
Whether or not it rains a week from now where you live may seem mostly random, but a long enough data record will likely reveal rainfall patterns that repeat over hours, months, or years. Atmospheric scientists describe some of these repeating patterns as cycles and others as oscillations. There are annual and daily precipitation cycles tied to the variation of the sun's path across the sky [1]. An example of precipitation affected by time of day is that summer thunderstorms occur predominantly in afternoon or early evening along the East Coast of the United States. An example of seasonal

IMERG Analyzes El Niño Fueled California Storms
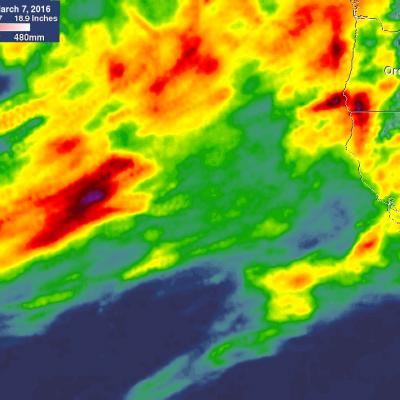
After a break in February, El Nino fueled storms have started pounding California as they move in from the Pacific Ocean. Northern California has been especially hard hit with heavy rainfall and strong winds being reported. Heavy rainfall north of Sacramento caused flooding that killed a woman in Olivehurst, California. Rain and snowfall in the Sierra Nevada mountains may help to alleviate the long lasting California drought. An analysis of total precipitation from February 29 to March 7, 1016 was accomplished using data collected by NASA's Multi-satellitE Retrievals for GPM (IMERG). This
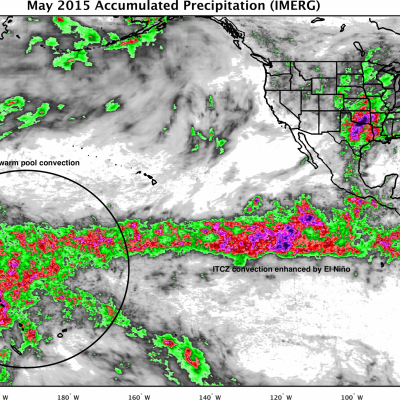
Global Precipitation Measurement (GPM) Is In Position to Watch Effects of 2015’s El Niño
Since late in 2014, scientists in many different disciplines (including meteorologists, climate scientists, physical and biological oceanographers, hydrologists, and geologists) have been watching a slow-to-develop El Niño even in the tropical Pacific Ocean. After teasing observers with conditions that did not quite meet El Niño criteria 1, the event finally reached official El Niño status in March and April, and is now expected to become a powerful event lasting into the next Northern Hemisphere winter. If these conditions, typified by warm sea surface temperatures (SST) in the tropical...