GPM

gpm-signs-of-spring-photo-contest
Spring is in the air, and with it lots of precipitation. The Global Precipitation Measurement mission (GPM), launched in February 2014, measures Earth’s precipitation from above using a constellation of satellites. GPM can tell us where and how much it is raining and snowing so we can learn more about Earth’s water cycle, better model our weather and climate, and predict floods, droughts, hurricanes, and more. As GPM watches spring weather from above, we want to see what spring looks like to you! Get out your cameras and show us the signs of spring in your area - from April showers to dew...

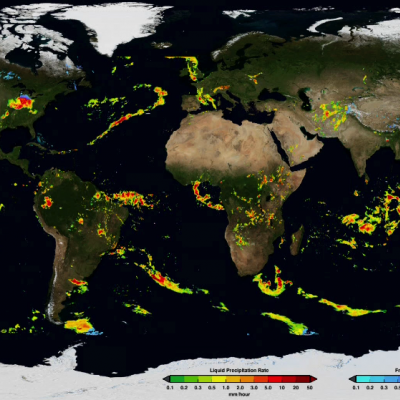
IMERG Data Now in Giovanni-4

The NASA Goddard Earth Sciences Data and Information Services Center (GES DISC) has recently added all of the half-hourly and monthly *Final* IMERG data variables to the next generation of Giovanni, Giovanni-4 (G4). Giovanni is a Web-based application developed by the GES DISC that provides a simple and intuitive way for users to visualize, analyze, and access vast amounts of Earth science remote sensing data, without having to download the data. Learn more: http://disc.sci.gsfc.nasa.gov/gesNews/imerg_in_G4
GPM's First Global Rainfall and Snowfall Map
The Global Precipitation Measurement mission has produced its first global map of rainfall and snowfall. Like a lead violin tuning an orchestra, the GPM Core Observatory – launched one year ago on Feb. 27, 2014, as a collaboration between NASA and the Japan Aerospace Exploration Agency – acts as the standard to unify precipitation measurements from a network of 12 satellites. The result is NASA's Integrated Multi-satellite Retrievals for GPM data product, called IMERG, which combines all of these data from 12 satellites into a single, seamless map. The map covers more of the globe than any...

Two Satellites Measured Rainfall in Tropical Depression Mekkhala

The first tropical depression of the 2015 western Pacific season formed southwest of Guam on January 13 and is predicted to intensify into a tropical storm while headed toward the Philippines. NASA's TRMM and GPM satellites provided a look at Tropical Depression Mekkhala's rainfall data that showed the area of moderate rainfall had expanded as the storm strengthened on January 13. Mekkhala was previously known as Tropical Depression 01W until January 14 when it was renamed. Both the Global Precipitation Measurement (GPM) core satellite and the Tropical Rainfall Measuring Mission (TRMM)

Updated GPM Radiometer Products

The Precipitation Processing System (PPS) has begun producing updated GPM radiometer products as of 12/4/2014 due to an error discovered in the calculation of the Sun Angle in the PPS Geolocation Toolkit. This is considered a minor update with the Product Version being incremented in letter only. Please see the list of affected products here: http://pps.gsfc.nasa.gov/Documents/GPM_PPS_SunAngle_Products_20141204.p… For most radiometers the sun angle is used as ancillary information, but for the TRMM microwave imager (TMI) the correction also slightly impacts brightness temperature and
TRMM And GPM Core Satellite See Sinlaku Headed Toward Vietnam JacobAdmin Mon, 12/01/2014
Tropical storm Sinlaku formed on November 26, 2014 over the southeastern Philippines. As a tropical depression Sinlaku caused flooding in areas of the Visayas and Mindanao. The TRMM and the GPM core satellite viewed Sinlaku after it had strengthened into a tropical storm over the South China Sea. The first image shows rainfall derived from TRMM Microwave Imager (TMI) data collected when the satellite flew over on November 28, 2014 at 0716 UTC. The second view shows rainfall from GPM Microwave Imager (GMI) measurements received a little over six hours later at 1326 UTC. Rainfall was measured by
Date Last Updated
October 2nd, 2020
Document Description

The transition from the Tropical Rainfall Measuring Mission (TRMM) data products to the Global Precipitation Measurement (GPM) mission products has begun. This document specifically addresses the multi-satellite products, the TRMM Multi-satellite Precipitation Analysis (TMPA), the real-time TMPA (TMPA-RT), and the Integrated Multi-satellitE Retrievals for GPM (IMERG).

GPM Scans Typhoon Phanfone
Animation revealing a swath of GPM/GMI precipitation rates over Typhoon Phanfone. The camera then moves down closer to the storm to reveal DPR's volumetric view of Phanphone. A slicing plane dissects the Typhoon from south to north and back again, revealing it's inner precipitation rates. Shades of blue indicate frozen precipitation (in the upper atmosphere). Shades of green to red are liquid precipitation which extend down to the ground. Download in Hi-Res from the Scientific Visualization Studio On October 6, 2014 (0215 UTC) the Global Precipitation Measurement (GPM) mission's Core...

GPM Data Goes Public

The most accurate and comprehensive collection of rain, snowfall and other types of precipitation data ever assembled now is available to the public. This new resource for climate studies, weather forecasting, and other applications is based on observations by the Global Precipitation Measurement (GPM) Core Observatory, a joint mission of NASA and the Japan Aerospace Exploration Agency (JAXA), with contributions from a constellation of international partner satellites. The GPM Core Observatory, launched from Japan on Feb. 27, carries two advanced instruments to measure rainfall, snowfall, ice
PMM Article Image
On September 26, the Global Precipitation Measurement (GPM) satellite flew over an extra-tropical cyclone whose center was approaching Norway. The Norwegian weather service reported that this storm brought gale-force winds to parts of Norway's coast and mountains (20 m/s in the mountains and 50 m/s just off-coast, late at night on September 26). Extra-tropical cyclones this strong or stronger are a regular feature of northern European winters. The particularly damaging ones are called "windstorms." Borrowing a page from hurricane forecasters, some weather agencies in affected countries name...