Kenneth

Intensifying Hurricane Kenneth Examined By GPM

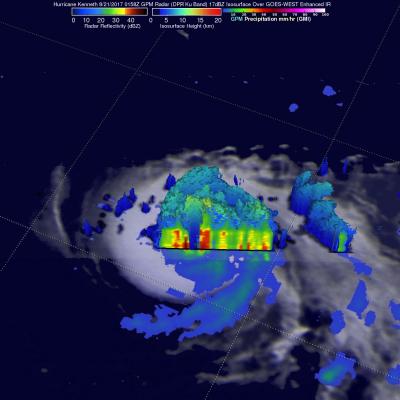
The GPM core observatory satellite flew over hurricane Kenneth when it was approaching it's peak power on August 21, 2017 at 0158 UTC. This rainfall map of hurricane Kenneth was derived from the GPM satellite's Microwave Imager (GMI) and Dual-Frequency Precipitation Radar (DPR) instruments. GPM's GMI data enables analysis of precipitation across a swath that is 550 miles (885 km) wide. GPM's radar (Ku Band) can be used to show three-dimensional maps of precipitation structure along a narrower 152 mile (245 km) swath. GPM's radar found rain falling at a rate of over 11.3 inches (286 mm) per

TRMM Sees Weakening Hurricane Kenneth

Hurricane Kenneth (in the eastern Pacific Ocean) reached powerful category four hurricane strength with wind speeds of 125 kts (~144 mph) on Tuesday 22 November 2011. The TRMM satellite passed directly above Kenneth as it was rapidly weakening on Wednesday 23 November 2011 at 0455 UTC. A rainfall analysis from TRMM's Micrwave Imager (TMI) and Precipitation Radar (PR) instruments is shown overlaid on an infrared image from TRMM's Visible and InfraRed Scanner (VIRS). Very heavy rainfall of over 50mm/hr (~2 inches) is shown by this analysis occurring in the northeastern side of Kenneth's eye wall

Tropical Storm Kenneth

The TRMM satellite had a good view of tropical storm Kenneth in the eastern Pacific Ocean when it passed above on 21 November 2011 at 0510 UTC (20 November 2011 9:10 PM PST). The National Hurricane Center (NHC) upgraded Kenneth to a hurricane on 21 November 2011 at 1500 UTC (7:00 AM PST) after determining that a ragged eye was forming. The image on the right shows a rainfall analysis derived from TRMM's Microwave Imager (TMI) and Precipitation Radar (PR) instruments. TMI data show that heavy rainfall was occurring around the center of Kenneth's circulation.