New England

GPM Catches Nor'easter over New England

Submitted by JacobAdmin on Tue, 04/11/2017
Video Embed

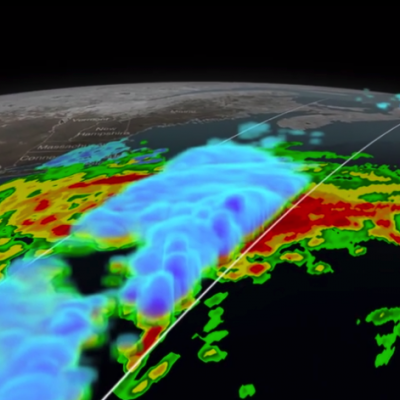
At the time of the Global Precipitation Measurement (GPM) Core Observatory overpass (April 1, 2017, 0550 UTC), the storm's center of low pressure was south of Long Island. At the mid-levels of the atmosphere, the circulation was centered over northeast Pennsylvania. This led to a classic overrunning, warm conveyor setup, which happened when the counterclockwise low level flow drew in cold air out of the north/northeast (hence "Nor'easter") from Canada.

GPM Catches Nor'easter over New England
At the time of the Global Precipitation Measurement (GPM) Core Observatory overpass (April 1, 2017, 0550 UTC), the storm's center of low pressure was south of Long Island. At the mid-levels of the atmosphere, the circulation was centered over northeast Pennsylvania. This led to a classic overrunning, warm conveyor setup, which happened when the counterclockwise low level flow drew in cold air out of the north/northeast (hence "Nor'easter") from Canada. Higher up, warm and moist air from further south was lifted over this cold air and resulted in precipitation in the form of snow at the surface...
GPM Sees Nor'easter Dump Snow on New England

Submitted by JacobAdmin on Wed, 01/28/2015
Video Embed

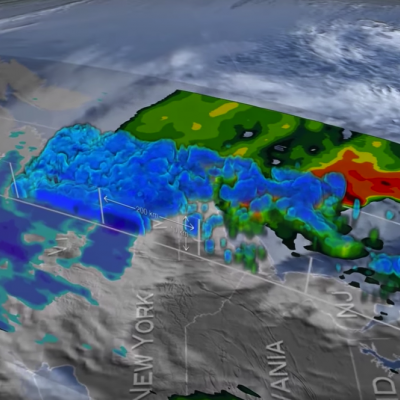
At 5:05 p.m. EST Monday, Jan. 26, 2015, the Global Precipitation Measurement mission's Core Observatory flew over the Nor'easter that dumped snow on New England. This satellite image shows the rate of rainfall, with low amounts in green and high in red, and snowfall, in blue to purple. The center of the storm, shown in 3-D, was offshore with far reaching bands of snowfall. More intense snow rates are shown in darker blue, which can be seen on the northern edge of the storm.

Signs of Spring Spring Weather What is spring to you?  Spring around the world March 20 - launch of contest
At 5:05 p.m. EST Monday, Jan. 26, 2015, the Global Precipitation Measurement mission's Core Observatory flew over the Nor'easter that dumped snow on New England. This satellite image shows the rate of rainfall, with low amounts in green and high in red, and snowfall, in blue to purple. The center of the storm, shown in 3-D, was offshore with far reaching bands of snowfall. More intense snow rates are shown in darker blue, which can be seen on the northern edge of the storm. Visible in the 3-D image of the center of the storm are the snowy tops of the clouds in blue and underneath where it...

TRMM Sees Intensifying Winter Storm

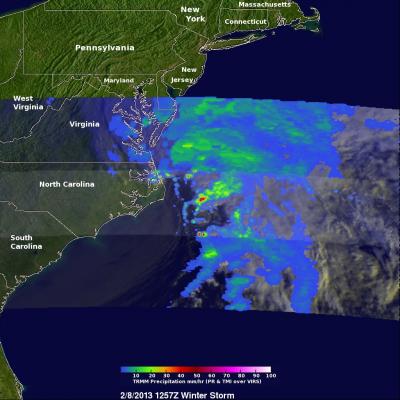
At 1257 UTC (7:57 AM EST) this morning the TRMM satellite passed above a rapidly deepening low pressure center over coastal North Carolina. TRMM already saw stormy weather with this low when it was forming yesterday along the Gulf coast. Another area of low pressure moving from the Mid-West is predicted to merge with this storm and result in extreme blizzard conditions over the North-East. Near hurricane force winds and snowfall depths of over 610mm (~24 inches) are predicted in some areas from New York to Boston. An analysis of rainfall from TRMM's Microwave Imager (TMI) and Precipitation

2013 New England Blizzard

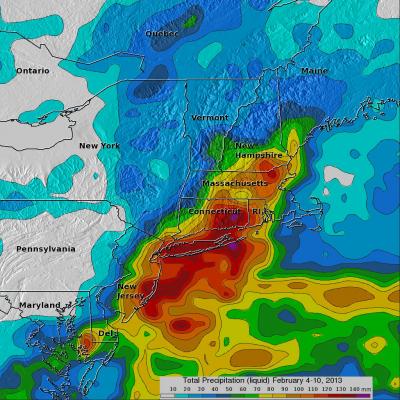
As accurately predicted by the National Weather Service, a blizzard dropped extreme amounts of snow over the North-East beginning on February 8, 2013. An amazing snow depth of 38 inches (~965 mm) was reported in Milford, Connecticut. The blizzard was reportedly the cause of at least 14 deaths in the United States and Canada. The TRMM-based, near-real time Multi-satellite Precipitation Analysis (TMPA) at the NASA Goddard Space Flight Center is used to estimate precipitation for much of the globe. TMPA (liquid) precipitation totals (mm) are shown for the week from February 4-10 when the blizzard