Oman

Two Cyclones Hit Somalia and Oman Within a Week

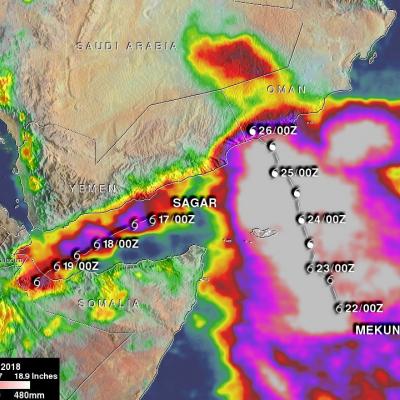
The first cyclone to strike the area, Sagar, formed from an area of thunderstorm activity located in the western Arabian Sea south of the island of Socatra. The area of low pressure associated with the thunderstorms first moved northwest into the far eastern Gulf of Aden, where it intensified into a minimal tropical storm with sustained winds estimated at 35 knots (~40 mph) by the Joint Typhoon Warning Center (JTWC), before turning west and then southwest down the middle of the Gulf. As it moved down the Gulf, Sagar slowly strengthened into a stronger tropical storm with sustained winds

Tropical Depression Near Oman Dissipates

The Joint Typhoon Warning Center (JTWC) issued it's last warning on dissipating tropical depression 04W in the Arabian Sea on 9 November 2011 at 1500 UTC. A rainfall analysis from TRMM data collected with a pass over 04A on 9 November 2011 at 1530 UTC is shown here. Data from TRMM's Microwave Imager (TMI) and Precipitation Radar (PR) show that heavy rainfall was extending from 04A's location in the Arabian Sea north-eastward toward Pakistan.

Another Possible Tropical Cyclone Approaches Oman

On November 2011 at 1541 UTC the TRMM satellite passed over another stormy area heading toward Oman from the Arabian sea . Another tropical cyclone may be forming in this area less than a week after deadly tropical storm Keila hit Oman. A rainfall analysis from TRMM's Microwave Imager (TMI) and Precipitation Radar (PR) is shown in the image above. Rainfall derived from PR data, shown in a lighter shade, reveals that an area of extremely heavy rainfall was located in the center of this stormy area. TRMM's PR data were again used to show the 3-D structure of this stormy area. Some of these very

TRMM Views Deadly Storm

Tropical storm Kelia caused the reported deaths of at least 11 people when it came ashore in Oman on Thursday 3 November 2011. TRMM's Microwave Imager (TMI) had a good early morning view of Keila on 3 November 2011 at 0254 UTC. The TMI rainfall analysis from these data was overlaid on a sunlit visible and infrared image from TRMM's Visible and InfraRed Scanner (VIRS). This rainfall analysis shows a large band of moderate to heavy rainfall wrapping around the eastern side of the storm and drenching coastal Oman.