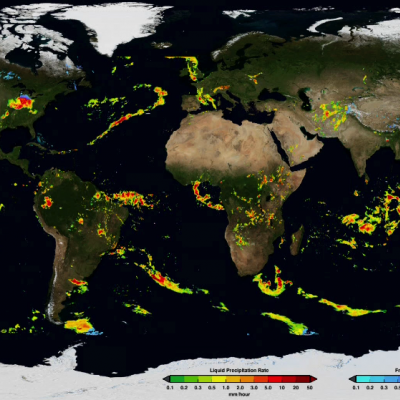
GPM

GPM content

GPM's Worldwide Tour of Global Precipitation
Rain, snow, hail, ice, and every mix in between make up the precipitation that touches everyone on our planet. But precipitation doesn't fall equally in all places around the world, as seen in NASA's new animation that captures every shower, snowstorm and tropical cyclone over a six-day period in August 2014. The time lapse was created from data captured by the Global Precipitation Measurement (GPM) satellite mission, now just over a year old, which scientists are using to better understand freshwater resources, natural disasters, crop health and more. Image Credit: NASA's Goddard Space Flight...
gpm-signs-of-spring-photo-contest
Spring is in the air, and with it lots of precipitation. The Global Precipitation Measurement mission (GPM), launched in February 2014, measures Earth’s precipitation from above using a constellation of satellites. GPM can tell us where and how much it is raining and snowing so we can learn more about Earth’s water cycle, better model our weather and climate, and predict floods, droughts, hurricanes, and more. As GPM watches spring weather from above, we want to see what spring looks like to you! Get out your cameras and show us the signs of spring in your area - from April showers to dew...
GPM's First Global Rainfall and Snowfall Map
The Global Precipitation Measurement mission has produced its first global map of rainfall and snowfall. Like a lead violin tuning an orchestra, the GPM Core Observatory – launched one year ago on Feb. 27, 2014, as a collaboration between NASA and the Japan Aerospace Exploration Agency – acts as the standard to unify precipitation measurements from a network of 12 satellites. The result is NASA's Integrated Multi-satellite Retrievals for GPM data product, called IMERG, which combines all of these data from 12 satellites into a single, seamless map. The map covers more of the globe than any...
3D Views of February Snow Storms from GPM
Download this video in HD formats from NASA Goddard's Scientific Visualization Studio The Global Precipitation Measurement (GPM) Core Observatory captured a 3-D image of a winter storm on Feb. 17, 2015, that left 6 to 12 inches of snow over much of Kentucky, southwestern West Virginia and northwestern North Carolina. The shades of blue indicate rates of snowfall, with more intense snowfall shown in darker blue. Intense rainfall is shown in red. The imagery shows great variation in precipitation types over the southeastern United States. Download this video in HD formats from NASA Goddard's...